Manipulated Stock Market Discounting a Recovery?
Stock-Markets / Recession 2008 - 2010 Dec 07, 2008 - 10:16 AM GMTBy: Mick_Phoenix

 Welcome to the Weekly Report. This week some fool decided the US had been in recession for a year. I hope they don't get paid too much. What I find amusing is that straight away all sorts of bull side writers and shills started talking about the US stock market being a discounting system, looking 6 months ahead, look for signs of recovery etc blah.
Piffle.
The stock markets are heavily manipulated right now, bans on short selling alone distort the real conditions of the stocks, government bailouts allow dead businesses to keep walking and the expectation of centralist bail outs for conglomerates considered too big to fail keep prices higher on mis-placed optimism. Attempting to use stock markets as a leading indicator with so much interference in place is not a wise move. Maybe one day in the future it will be worth monitoring stocks but right now they are a sideshow.
Anyway, back to our 12 month recession, was there anything that we could have monitored over the past 12 months that would have indicated what was coming?
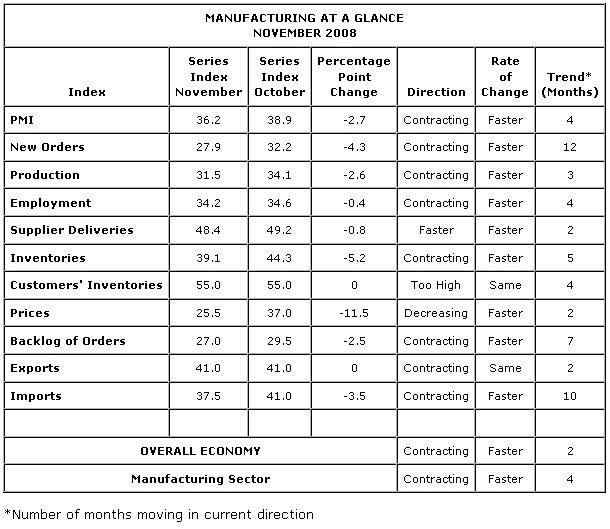
Here is the ISM report for manufacturing:
- WHAT RESPONDENTS ARE SAYING ...
"The only positive thing of late is that the U.S. dollar has strengthened significantly against other currencies. We import the majority of our materials so this will have the effect of lowering our COGS." (Transportation Equipment)
"Steel industry is our main customer, and they have had a real slowdown." (Computer & Electronic Products)
"Criteria for projects is significantly higher with very short ROI periods." (Food, Beverage & Tobacco Products)
"We have revised downward our top-line sales estimates for CY2009 by 8 percent due to the continued softness we see in the housing sector." (Machinery)
"Suppliers are trying to hold onto pricing, but petrochemical and commodity prices are dropping like a rock." (Plastics & Rubber Products)
No sign of a bottom here then. Indeed it looks as if the trends are continuing and at a faster pace. Notice new orders and imports? If I had to use the ISM report as an indicator, it would be these 2 series I would watch for signs that the current trends in manufacturing may be changing.
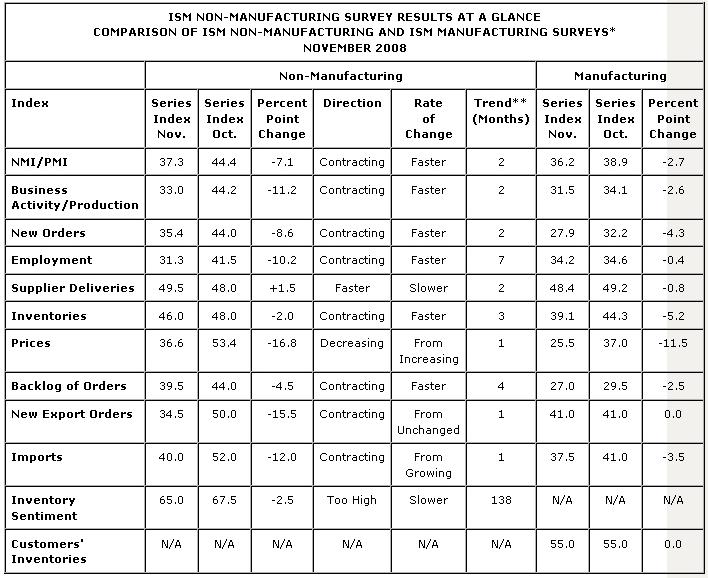
How about non-manufacturing ISM?
* Non-Manufacturing ISM Report On Business® data is seasonally adjusted for Business Activity, New Orders, Prices and Employment. Manufacturing ISM Report On Business® data is seasonally adjusted for New Orders, Production, Employment, Supplier Deliveries and Inventories.
** Number of months moving in current direction.
- WHAT RESPONDENTS ARE SAYING ...
"General slowdown and cost-cutting actions." (Other Services)
"Business remains strong despite the general economy." (Health Care & Social Assistance)
"Although funding for our core goals has not changed, new programs will be curtailed." (Educational Services)
"Store closures with associated employee layoffs, the continued downturn in the construction sector and the curtailment of local government spending have combined to hammer the local economy." (Public Administration)
"One unusual aspect of the current environment is that suppliers are getting very selective about who they conduct business with. We are spending more and more time ensuring that our key [suppliers] continue to see us as a key customer." (Retail Trade)
"General concerns about the economy continue to impact consumer confidence and our sales." (Accommodation & Food Services)
Here the trends are not as pronounced as manufacturing but as we can see the trend is one of falling activity that is accelerating. Interestingly employment, often accused of being a lagging indicator, was the first series to show slowdown and the November reading should have made Fridays unemployment figures unsurprising. I would recommend that you keep an eye on the ISM report over the next year, especially those series that gave an early warning of the current situation. Right now I see absolutely nothing that would want me to buy stocks based on a macro-economic viewpoint.
So if stock markets are not telling us the whole story, what is?
Courtesy of StockCharts.com
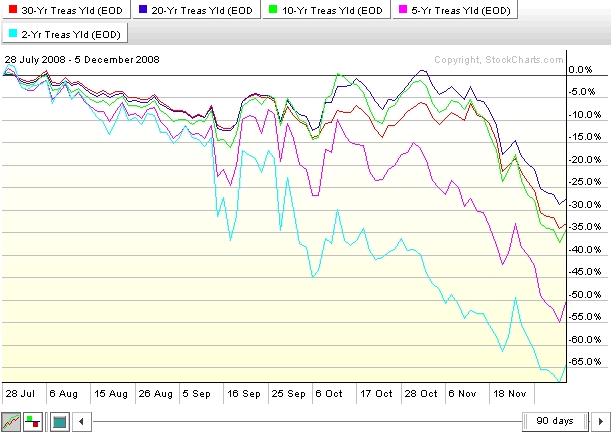
Yields have plunged across the board since July but a noticeable acceleration of the trend kicked in during late October. This follows on from last weeks report were subscribers read about the move of the US into a Quantitative Easing policy (QE) which involves Ben Bernanke's favoured method of controlling the yield curve across all bond asset classes:
- "A more direct method, which I personally prefer, would be for the Fed to begin announcing explicit ceilings for yields on longer-maturity Treasury debt (say, bonds maturing within the next two years). The Fed could enforce these interest-rate ceilings by committing to make unlimited purchases of securities up to two years from maturity at prices consistent with the targeted yields. If this program were successful, not only would yields on medium-term Treasury securities fall, but (because of links operating through expectations of future interest rates) yields on longer-term public and private debt (such as mortgages) would likely fall as well."
Such support for all bond classes tells us 2 things. The first is that treasury bonds may be expensive and low yielding now but that does not mean they have hit a peak. Beware of shorting bonds just yet. Secondly, the measures mentioned in Bernanke's remarks were from his speech in 2002 titled Deflation, making sure "it" doesn't happen here, however the remarks were in the section titled "Curing deflation". Ben thinks we are already in a deflationary environment; he is not trying to prevent "it" but cure "it".
Quantitative Easing is another way of acknowledging moral hazard and increasing it exponentially. Once started, as Bernanke is beginning to discover, QE cannot be suddenly dropped from the game plan as its very existence becomes the only bulwark of confidence for all markets. The inevitable outcome of QE, on the scale envisaged by Bernanke, when taken to its conclusion is that no asset can be left outside of the guarantee, regardless of the solvency of the underlying corporation. This was the lesson Japan learned when it underwrote its banking sector. Bernanke has a much greater struggle to contend with, he has to underwrite practically the whole economy.
Many economic writers are currently looking at the rise of M1& M2 and shouting about the inflation that will occur in the near future, however they are looking at the new situation through the wrong lens:
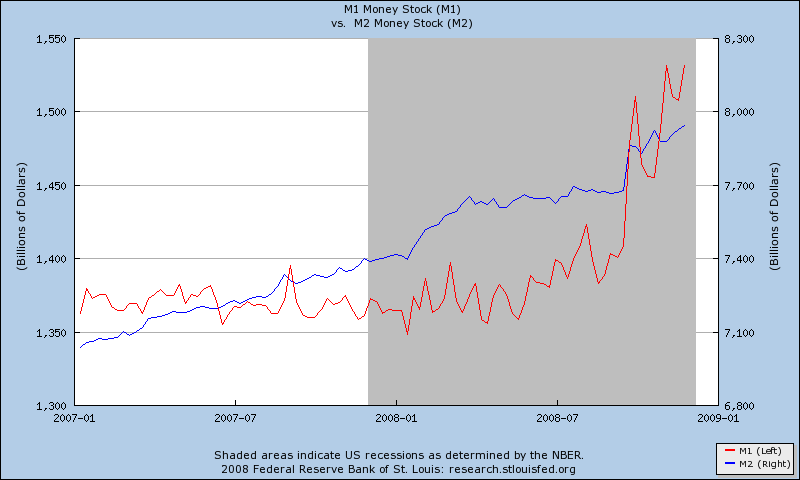
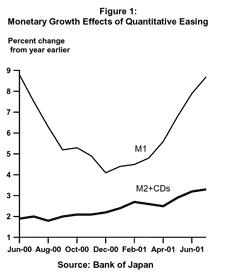 Is the rise in M1&M2 unexpected? Clearly, those that have studied QE in Japan would say no:
The comparison to the M1/M2 Fed chart is no coincidence. The outcome of the US adopting a QE policy will have wide ranging consequences but today I want to flag up a comparison that can be used by investors.
The rest of the article is subscriber only. To visit An Occasional Letter click here
By Mick Phoenix
www.caletters.com
An Occasional Letter in association with Livecharts.co.uk
To contact Michael or discuss the letters topic E Mail mickp@livecharts.co.uk .
Copyright © 2008 by Mick Phoenix - All rights reserved.
Disclaimer: The above is a matter of opinion and is not intended as investment advice. Information and analysis above are derived from sources and utilizing methods believed reliable, but we cannot accept responsibility for any trading losses you may incur as a result of this analysis. Do your own due diligence.
Mick Phoenix Archive |
© 2005-2022 http://www.MarketOracle.co.uk - The Market Oracle is a FREE Daily Financial Markets Analysis & Forecasting online publication.


