


The Velocity of Money and Economic Deflation
Economics / Recession 2008 - 2010 Dec 06, 2008 - 09:37 AM GMTBy: John_Mauldin

 "A severe global recession will lead to deflationary pressures. Falling demand will lead to lower inflation as companies cut prices to reduce excess inventory. Slack in labour markets from rising unemployment will control labor costs and wage growth. Further slack in commodity markets as prices fall will lead to sharply lower inflation. Thus inflation in advanced economies will fall towards the 1 per cent level that leads to concerns about deflation.
"Deflation is dangerous as it leads to a liquidity trap, a deflation trap and a debt deflation trap: nominal policy rates cannot fall below zero and thus monetary policy becomes ineffective. We are already in this liquidity trap since the Fed funds target rate is still 1 per cent but the effective one is close to zero as the Federal Reserve has flooded the financial system with liquidity; and by early 2009 the target Fed funds rate will formally hit 0 per cent. Also, in deflation the fall in prices means the real cost of capital is high - despite policy rates close to zero - leading to further falls in consumption and investment. This fall in demand and prices leads to a vicious circle: incomes and jobs are cut, leading to further falls in demand and prices (a deflation trap); and the real value of nominal debts rises (a debt deflation trap) making debtors' problems more severe and leading to a rising risk of corporate and household defaults that will exacerbate credit losses of financial institutions." - Professor Nouriel Roubini of New York University
I had breakfast with Nouriel this morning down in Soho (I am in New York today). I thought the above quote was an excellent way to lead off this week's letter. Some of the more important questions of the moment are whether we face a serious bout of deflation, and if so, what can be done about it. There are market observers who are looking at the graphs which show the meteoric rise in the monetary base (see below) and predict that we will soon see much higher and rising inflation and a seriously falling dollar (accompanied with a large rise in gold). Is inflation everywhere and always a monetary phenomenon, as Friedman taught us? Can we see a large rise in the monetary base that is not accompanied by inflation? As Frederic Bastiat said (roughly), "In economics there is what you see and then there is what you don't see." The more important of the two items is what you don't see. In this week's letter we talk about what most market observers are not seeing, and why you should be paying attention.
We are going to revisit portions of an important e-letter I wrote earlier this year about the velocity of money. I am updating the charts and adding a lot of new commentary. I cannot overly stress how important this is. If you want to understand the markets, the dollar, gold, and more, you have to have this information down. You will need to put on your thinking cap, as much of what I am writing is counterintuitive and certainly not considered as received wisdom in much of the financial-commentator media. (Note: this letter will print longer than usual as there are a lot of graphs.)
Also, I am going to make an important announcement at the end of the letter about a new information service, and I need feedback from some of you.
Richard Russell Tribute
But first, I and some of my fellow newsletter writers (Bill Bonner and Dennis Gartman, among others, are slated to be there) are going to be hosting a special tribute dinner to honor Richard Russell for his outstanding contribution of over 50 years to not only the craft of investment writing but to the lives and investment portfolios of his readers. He is one of my personal heroes as well as a good friend. At 84, his writing today is better than ever, and now he writes every day, not just once a month! Richard is an institution in the investment writing world, and after talking with his wife Faye he has said he would let us plan the dinner.
Richard has some of the most loyal readers anywhere. I have personally talked to readers who have been reading Dow Theory Letters almost since the beginning (1956), and their enthusiasm for all things Richard has not waned.
We really hope we can get a roomful of Richard's friends, writing colleagues, and fans who have benefited from his wisdom over the years, to honor him for a life well lived and a true servant's spirit, as well as being a guide not just in the markets but in life. The dinner will be Saturday evening, April 4, 2009 in San Diego. In order to know how many people we should plan for, please send an email to russelltribute@2000wave.com indicating how many tickets you would like. Plan on the tickets being around $200, with any money left over going to Richard's favorite charity. I actually expect tickets to go rather fast, so let us know as soon as possible. We will get back into contact with you as to the exact time and place. Thanks.
The Velocity Factor
When most of us think of the velocity of money, we think of how fast it goes through our hands. I know at the Mauldin household, with seven kids, it seems like something is always coming up. And with Christmas looming, the velocity, at least in terms of how fast money seems to go out the door, seems faster than normal. And what about my business? Travel costs are way, way up; and as aggressive as we are on the budget, expenses always seem to rise. Compliance, legal, and accounting costs are through the roof. I wonder how those costs are accounted for in the Consumer Price Index? About the only way to deal with it is, as my old partner from the 1970s Don Moore used to say, is to make up the rise in costs with "excess profits," whatever those are.
Is the Money Supply Growing or Not?
But we are not talking about our personal budgetary woes, gentle reader. Today we tackle an economic concept called the velocity of money and how it affects the growth of the economy. Let's start with a few charts showing the recent high growth in the money supply that many are alarmed about. The money supply is growing very slowly, alarmingly fast, or just about right, depending upon which monetary measure you use.
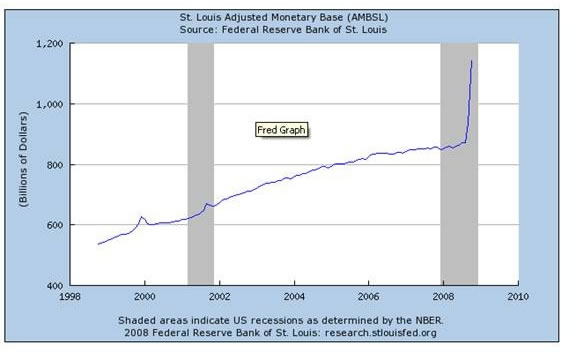
First, let's look at the adjusted monetary base, or plain old cash plus bank reserves (remember that fact) held at the Federal Reserve. That is the only part of the money supply the Fed has any real direct control of. Until very recently, there was very little year-over-year growth. The monetary base grew along a rather predictable long-term trend line, with some variance from time to time, but always coming back to the mean.
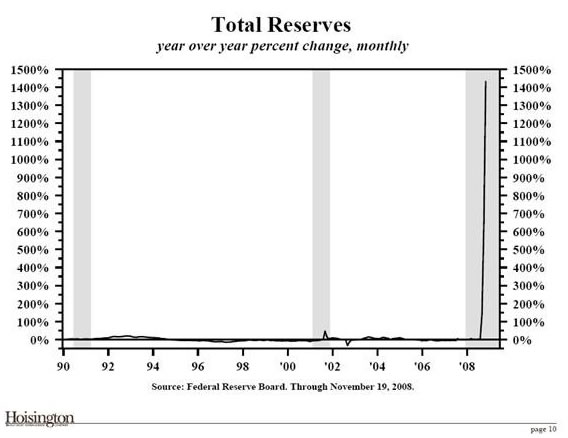
But in the last few months the monetary base has grown by a staggering amount - by over 1400% on an annual basis, as shown in the next chart from my friend Dr. Lacy Hunt at Hoisington Asset Management. And when you see the "J-curve" in the monetary base (which is likely to rise even more!) it does demand an explanation. There are those who suggest this is an indication of a Federal Reserve gone wild and that 2,000-dollar gold and a plummeting dollar are just around the corner. They are looking at that graph and leaping to conclusions. But it is what you don't see that is important.
Now, the same graph but in percentage terms:
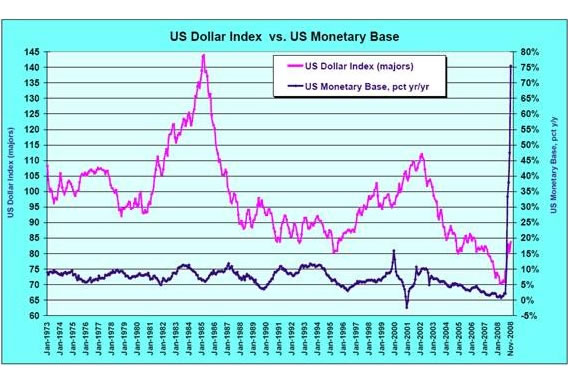
Several of my readers have sent me questions related to the chart below, which compares the above graph to the value of the US dollar, as measured in the trade-weighted dollar index. If the Fed is flooding the market with dollars, does that not mean a crash in the dollar is imminent? What foreign government or investor would want to hold dollars when the Fed is debasing the currency so rapidly?
Give Me Your Tired, Your Poor, Your Illiquid
The answer is that the Fed is not creating money in the sense of, say, monetizing the national debt (that comes later in the letter). Remember that the adjusted monetary base is cash plus bank reserves on deposit at the Fed. Banks have to hold a certain portion of their assets as liquid assets in order to meet potential demand from depositors for their money. If they go below that required number, the regulators come in and demand they increase their liquid assets immediately.
Various assets have been getting a "haircut" as to their ability to count as liquid reserves. With more and more assets becoming illiquid, the amount of money held in the liquid asset portion of many US banks assets has been dwindling. What to do? The Fed decided to take these assets and trade them (temporarily) for US treasuries, which are quite liquid. It's a kind of "Give me your tired, your poor, your humble illiquid assets yearning to be free" program to allow banks to stay in regulatory compliance.
But notice something. While the Fed did create the T-bills, they did not inject new capital into the overall system. If a bank had one billion in assets and gave the Fed $100 million to get liquid T-bills, it still just has $1 billion in assets. Yes, it could sell them to someone else to get cash, but that someone else would use already existing dollars. The Fed has provided liquidity but did not inject (yet) new cash into the overall system through this program. At some point in the future, when banks are once again doing business with each other and the system is more liquid, banks will take those T-bills back to the Fed and receive back whatever collateral they used to get them in the first place.
To illustrate what I am saying, let's look at MZM, or Money of Zero Maturity. Stated another way, you can think of it as cash, whether in a bank, a money market fund, or in your hands. We will look at the growth of MZM in the next two charts, one of which shows the actual growth and the other the growth in annual percentage terms.
Now remember, Friedman taught us that inflation is a monetary phenomenon. If you increase the money supply too fast, you risk an unwanted rise in inflation. If the money supply shrinks or grows too slowly, you could see deflation develop.
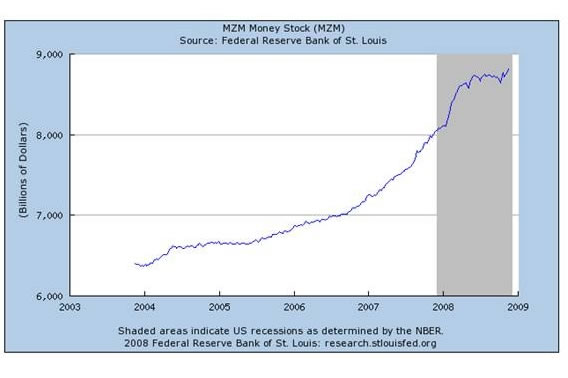
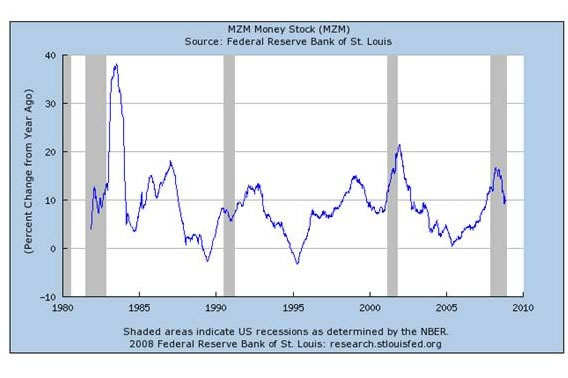
Note that MZM was growing at close to an 18% rate year over year earlier in the year but that growth is now down to 10%. Also note that less than three years ago MZM was growing close to zero. Since that time inflation has increased. Therefore, one could make the case that the Fed is causing inflation by allowing the money supply to increase too rapidly. Case closed?
Maybe not. Correlation is NOT causation. More cash sometimes means that people and businesses are taking less risk. The Fed cannot control what we do with our money, only how much bank reserves it allows and how much cash it puts into the system.
Forecasting inflation from a money-supply graph is very difficult. It used to be a lot simpler, but in recent decades has been very unreliable, for reasons we will look at in a moment. But it is much too simplistic to draw a direct comparison between inflation and an arbitrary money-supply measure.
If we look at a graph of M2, which includes time deposits, small certificates of deposit, etc., we again see a rise in recent growth. M2 is the measure of money supply that most economists use when they are thinking about inflation. And we see that M2 is growing at a sprightly 7% year over year. This is not all that high historically, but again it is up significantly from the past few years. See the graph below. Note that there have been several times (as recently as 2000) when annual M2 growth was over 10%.
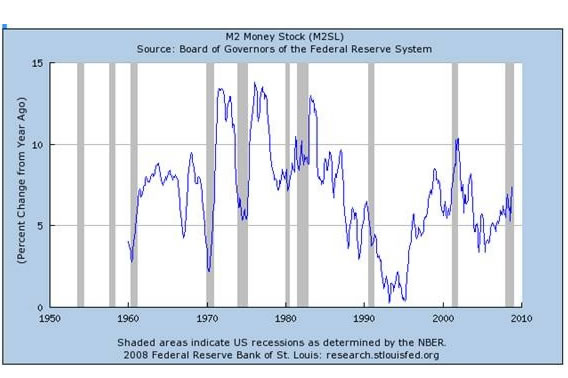
But there is more to the inflation/deflation debate than just money supply. Money supply is what you see. And now we look at what most of us don't see.
The Velocity of Money
Now, let's introduce the concept of the velocity of money. Basically, this is the average frequency with which a unit of money is spent. Let's assume a very small economy of just you and me, which has a money supply of $100. I have the $100 and spend it to buy $100 worth of flowers from you. You in turn spend the $100 to buy books from me. We have created $200 of our "gross domestic product" from a money supply of just $100. If we do that transaction every month, in a year we would have $2400 of "GDP" from our $100 monetary base.
So, what that means is that gross domestic product is a function not just of the money supply but how fast the money supply moves through the economy. Stated as an equation, it is Y=MV, where Y is the nominal gross domestic product (not inflation-adjusted here), M is the money supply, and V is the velocity of money. You can solve for V by dividing Y by M. (In last April's discussion of the velocity of money I used "P" instead of "Y". Lacy Hunt tells me the more correct statement of the equation is Y=MV, and I defer to the expert. Sorry for any confusion.)
Now, let's complicate our illustration just a bit, but not too much at first. This is very basic, and for those of you who will complain that I am being too simple, wait a few pages, please. Let's assume an island economy with 10 businesses and a money supply of $1,000,000. If each business does approximately $100,000 of business a quarter, then the gross domestic product for the island would be $4,000,000 (4 times the $1,000,000 quarterly production). The velocity of money in that economy is 4.
But what if our businesses got more productive? We introduce all sorts of interesting financial instruments, banking, new production capacity, computers, etc.; and now everyone is doing $100,000 per month. Now our GDP is $12,000,000 and the velocity of money is 12. But we have not increased the money supply. Again, we assume that all businesses are static. They buy and sell the same amount every month. There are no winners and losers as of yet.
Now let's complicate matters. Two of the kids of the owners of the businesses decide to go into business for themselves. Having learned from their parents, they immediately become successful and start doing $100,000 a month themselves. GDP potentially goes to $14,000,000. But, in order for everyone to stay at the same level of gross income, the velocity of money must increase to 14.
Now, this is important. If the velocity of money does NOT increase, that means (in our simple island world) that on average each business is now going to buy and sell less each month. Remember, nominal GDP is money supply times velocity. If velocity does not increase and money supply stays the same, GDP must stay the same, and the average business (there are now 12) goes from doing $1,200,000 a year down to $1,000,000.
Each business now is doing around $80,000 per month. Overall production on our island is the same, but is divided up among more businesses. For each of the businesses, it feels like a recession. They have fewer dollars, so they buy less and prices fall. They fall into actual deflation (very simplistically speaking). So, in that world, the local central bank recognizes that the money supply needs to grow at some rate in order to make the demand for money "neutral."
It is basic supply and demand. If the demand for corn increases, the price will go up. If Congress decides to remove the ethanol subsidy, the demand for corn will go down, as will the price.
If the central bank increased the money supply too much, you would have too much money chasing too few goods, and inflation would rear its ugly head. (Remember, this is a very simplistic example. We assume static production from each business, running at full capacity.)
Let's say the central bank doubles the money supply to $2,000,000. If the velocity of money is still 12, then the GDP would grow to $24,000,000. That would be a good thing, wouldn't it?
No, because only 20% more goods is produced from the two new businesses. There is a relationship between production and price. Each business would now sell $200,000 per month or double their previous sales, which they would spend on goods and services, which only grew by 20%. They would start to bid up the price of the goods they want, and inflation sets in. Think of the 1970s.
So, our mythical bank decides to boost the money supply by only 20%, which allows the economy to grow and prices to stay the same. Smart. And if only it were that simple.
Let's assume 10 million businesses, from the size of Exxon down to the local dry cleaners, and a population which grows by 1% a year. Hundreds of thousands of new businesses are being started every month, and another hundred thousand fail. Productivity over time increases, so that we are producing more "stuff" with fewer costly resources.
Now, there is no exact way to determine the right size of the money supply. It definitely needs to grow each year by at least the growth in the size of the economy, plus some more for new population, and you have to factor in productivity. If you don't then deflation will appear. But if money supply grows too much, then you've got inflation.
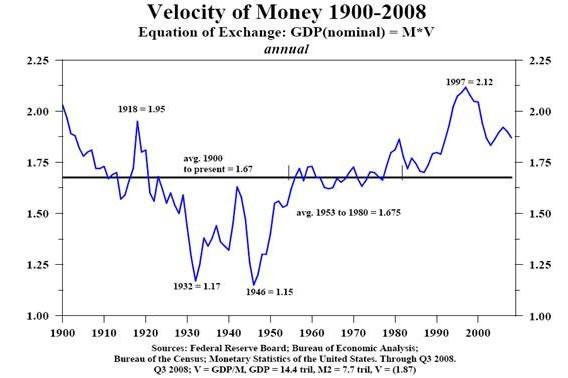
And what about the velocity of money? Friedman assumed the velocity of money was constant. And it was from about 1950 until 1978 when he was doing his seminal work. But then things changed. Let's look at two charts sent to me by Lacy. First, let's look at the velocity of money for the last 108 years.
Notice that the velocity of money fell during the Great Depression. And from 1953 to 1980 the velocity of money was almost exactly the average for the last 100 years. Also, Lacy pointed out, in a conversation which helped me immensely in writing this letter, that the velocity of money is mean reverting over long periods of time. That means one would expect the velocity of money to fall over time back to the mean or average. Some would make the argument that we should use the mean from more modern times since World War II, but even then mean reversion would mean a slowing of the velocity of money (V), and mean reversion implies that V would go below (overcorrect) the mean. However you look at it, the clear implication is that V is going to drop. In a few paragraphs, we will see why that is the case from a practical standpoint. But let's look at the first chart.
Now, let's look at the same chart since 1959, but with shaded gray areas which show us the times the economy was in recession. Note that (with one exception in the 1970s) velocity drops during a recession. What is the Fed response? An offsetting increase in the money supply to try and overcome the effects of the business cycle and the recession. Y=MV. If velocity falls then the money supply must rise for nominal GDP to grow. The Fed attempts to jump-start the economy back into growth by increasing the money supply.
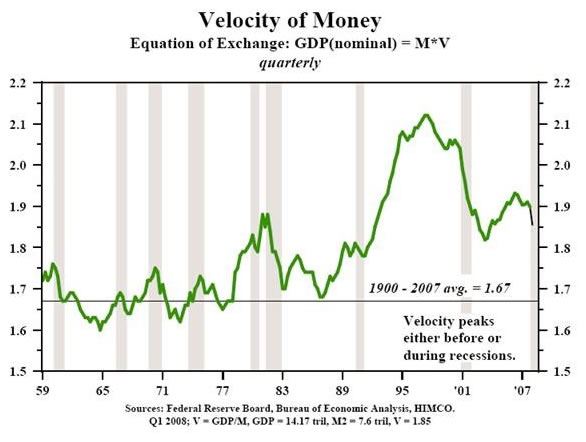
In this chart, Lacy assumes we are already in recession (gray bar at far right). The black line is his projection of velocity in the near future. If you can't read the print at the bottom of the chart, he assumes that GDP is $14.17 trillion, M2 is $7.6 trillion and therefore velocity is 1.85, down from almost 1.95 just a few years ago. If velocity reverts to or below the mean, it could easily drop 10% from here. We will explore why this could happen in a minute.
Y=MV
But let's go back to our equation, Y=MV. If velocity slows by 10% (which it well should) then money supply (M) would have to rise by 10% just to maintain a static economy. But that assumes you do not have 1% population growth, 2% (or thereabouts) productivity growth, and a target inflation of 2%, which means M (money supply) would need to grow about 5% a year, even if V is constant. And that is not particularly stimulative, given that we are in recession. And notice above that M2 is growing just about in line with that.
Bottom line? Expect money-supply growth well north of 7% annually for the next few years. Is that enough? Too much? About right? We won't know for a long time. This will allow armchair economists (and that is most of us) to sit back and Monday morning quarterback for many years.
My friends at GaveKal have their own measure of world velocity, and as you might expect it is slowing too. This slowing is a global problem and is one of the reasons we are in a global recession.
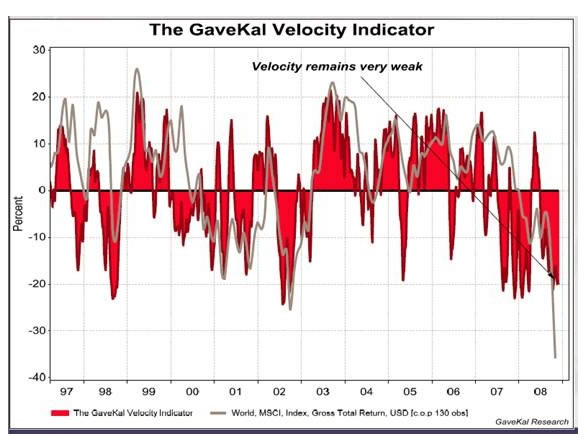
A Slowdown in Velocity
Now, why is the velocity of money slowing down? Notice the significant real rise in V from 1990 through about 1997. Growth in M2 (see the above chart) was falling during most of that period, yet the economy was growing. That means that velocity had to have been rising faster than normal. Why? It is financial innovation that spurs above-trend growth in velocity. Primarily because of the financial innovations introduced in the early '90s, like securitizations, CDOs, etc., we saw a significant rise in V.
And now we are watching the Great Unwind of financial innovations, as they went to excess and caused a credit crisis. In principle, a CDO or subprime asset-backed security should be a good thing. And in the beginning they were. But then standards got loose, greed kicked in, and Wall Street began to game the system. End of game.
What drove velocity to new highs is no longer part of the equation. The absence of new innovation and the removal of old innovations (even if they were bad innovations, they did help speed things up) are slowing things down. If the money supply did not rise significantly to offset that slowdown in velocity, the economy would already be in a much deeper recession.
While the Fed does not have control over M2, when they lower interest rates it is supposed to make us want to take on more risk, borrow money, and boost the economy. So, they have an indirect influence.
I expect the Fed to cut at least another 50 basis points next week, and to give us a statement with a nod toward difficult economic conditions. The latest Beige Book from the Fed was simply dreadful, so you can bet the governors will have a deteriorating economy in mind. Given the 25-plus-year low in consumer confidence, they have little choice.
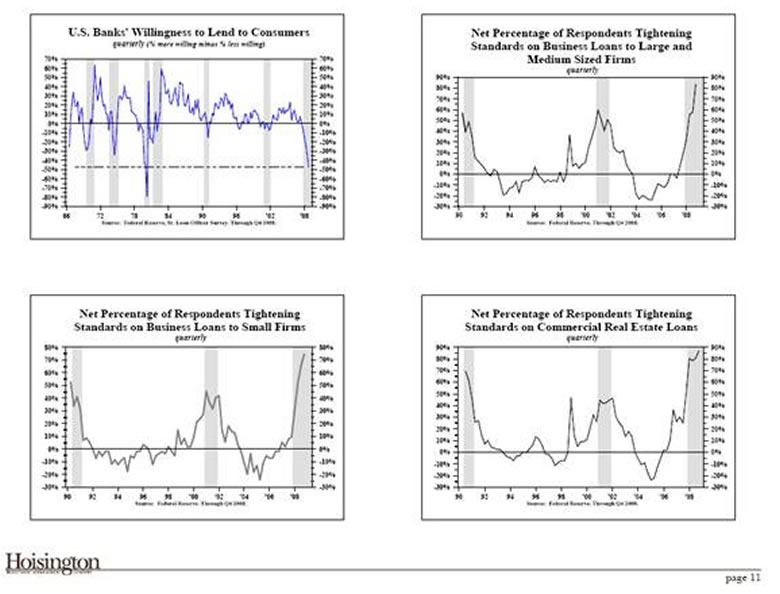
I agree with Nouriel that the Fed will soon move rates close to zero. For all intents and purposes, the markets have already moved there. But is it having an effect on the willingness of banks to lend? Not hardly. Standards for lending are tightening every week. Look at the graphs below. The willingness of banks to make consumer loans is dropping to a 28-year low. And they are tightening standards on all sorts of business loans.
Now, I argued above that the Fed is not really expanding the money supply, so far. But within a few quarters, we will be facing outright deflation. The Fed is going to monetize at least a portion of what will be a $1+ trillion dollar US deficit. They have announced they are going to purchase $800 billion in mortgage-backed and other types of consumer loan assets. That will be a direct infusion of dollars into the economy. That is serious monetization. But they may feel they have no choice if they want to keep the US economy from going Japanese.
When someone becomes a Fed governor, they take them into a back room and perform a DNA transplant on them. They come out of that room viscerally, almost genetically, focused on preventing deflation from happening on their watch.
How much monetization will be enough to halt deflation and overcome the slowdown in the velocity of money and the rise in personal savings? No one knows. There is no fancy equation or model which can encompass all the factors, or at least not one I know of.
We will also soon see which of the additional deflation-fighting policies that Bernanke outlined in his 2002 "helicopter" speech the Fed will adopt. It is highly likely that we will see more than a few of them. It is quite possible that we will see the Fed start to set rates on longer-term bills and even bonds in an effort to pull down longer-term rates for corporations and individuals.
We will explore all the deflation-fighting options and what the results might be in future letters, but remember that there will come a time when the Fed will have to "take back" some of the liquidity they are going to provide. That means we could be in for a multi-year period of slow growth after we pull out of this recession. And this recession could easily last through 2009.
A Conversation with John and Friends
Next week, I will announce a brand new subscription service that we will be offering to you. I travel and speak all over the world, and during this time I get to have private dinners and personal telephone conversations with some of the best minds in this business. Tiffani has often remarked what an education she gets just sitting at the table with us, and wishes she could have recorded the conversations for everyone to listen to.
And that is what we have decided to do. We are going to invite you to regularly "meet me" at the table for conversations with my friends and colleagues. This will be the only place you will be able to listen to detailed conversations with my colleagues who are leading experts in their fields. These encounters will be designed so that out of the mountain of information available, you get a concise view of the current landscape and can be motivated to make better decisions in your personal and business economic life.
This week, would you please let me know what you think? Here are two additional ideas in the works:
1. George Friedman of Stratfor and I spent a day together last week, brainstorming. We decided we are going to have quarterly conference calls to analyze the geopolitical landscape and discuss the immediate economic implications. You will get to listen.
2. I get hundreds of intelligent questions each week that, if answered, could benefit all of my readers. We will be giving you a place to drop your questions into a "Virtual Hat," and I will then answer them on a protected website.
While the basic format and level of service in Thoughts from the Frontline is not going to change, in the first half of 2009 we will be launching these new, unique subscription services.
Which of these services would benefit your life? Do you have any compelling ideas that I haven't mentioned that you would like our firm to pursue? What do you enjoy about Frontline Thoughts? What changes if any would you like to see? Please let Tiffani and me have your feedback (good or constructive) and your ideas - send them to eu@2000wave.com. As an incentive, she will randomly pick 5 emails to receive a free annual subscription to one of the new services. Thanks very much.
The letter is already long, so I will refrain from personal remarks this week. Enjoy your week.
Your knowing that we will all get through this analyst,
By John Mauldin
John Mauldin, Best-Selling author and recognized financial expert, is also editor of the free Thoughts From the Frontline that goes to over 1 million readers each week. For more information on John or his FREE weekly economic letter go to: http://www.frontlinethoughts.com/learnmore
To subscribe to John Mauldin's E-Letter please click here:http://www.frontlinethoughts.com/subscribe.asp
Copyright 2008 John Mauldin. All Rights Reserved
John Mauldin is president of Millennium Wave Advisors, LLC, a registered investment advisor. All material presented herein is believed to be reliable but we cannot attest to its accuracy. Investment recommendations may change and readers are urged to check with their investment counselors before making any investment decisions. Opinions expressed in these reports may change without prior notice. John Mauldin and/or the staff at Millennium Wave Advisors, LLC may or may not have investments in any funds cited above. Mauldin can be reached at 800-829-7273.
Disclaimer PAST RESULTS ARE NOT INDICATIVE OF FUTURE RESULTS. THERE IS RISK OF LOSS AS WELL AS THE OPPORTUNITY FOR GAIN WHEN INVESTING IN MANAGED FUNDS. WHEN CONSIDERING ALTERNATIVE INVESTMENTS, INCLUDING HEDGE FUNDS, YOU SHOULD CONSIDER VARIOUS RISKS INCLUDING THE FACT THAT SOME PRODUCTS: OFTEN ENGAGE IN LEVERAGING AND OTHER SPECULATIVE INVESTMENT PRACTICES THAT MAY INCREASE THE RISK OF INVESTMENT LOSS, CAN BE ILLIQUID, ARE NOT REQUIRED TO PROVIDE PERIODIC PRICING OR VALUATION INFORMATION TO INVESTORS, MAY INVOLVE COMPLEX TAX STRUCTURES AND DELAYS IN DISTRIBUTING IMPORTANT TAX INFORMATION, ARE NOT SUBJECT TO THE SAME REGULATORY REQUIREMENTS AS MUTUAL FUNDS, OFTEN CHARGE HIGH FEES, AND IN MANY CASES THE UNDERLYING INVESTMENTS ARE NOT TRANSPARENT AND ARE KNOWN ONLY TO THE INVESTMENT MANAGER.
John Mauldin Archive |
© 2005-2022 http://www.MarketOracle.co.uk - The Market Oracle is a FREE Daily Financial Markets Analysis & Forecasting online publication.