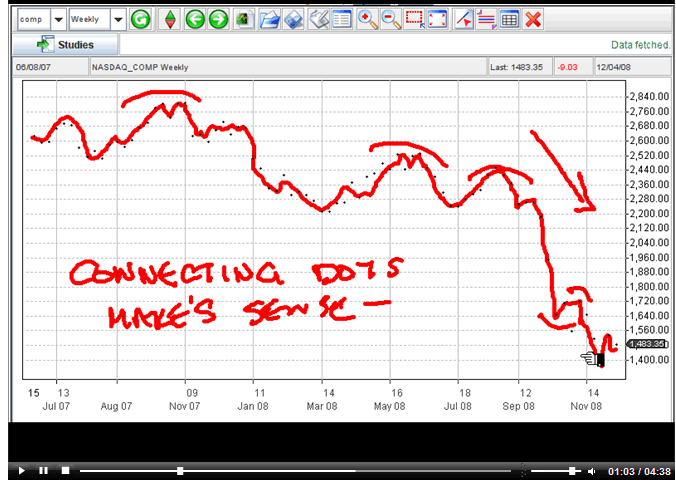
Stock Market Volatility Connecting the Dots Analysis Video
Stock-Markets / Volatility Dec 05, 2008 - 08:37 AM GMTBy: INO

 One of the easiest ways to determine the trend in any market is simply to connect the dot's. In this five minute video, I explain how you can connect the dots in any market to determine its trend. I will show you three examples of connecting the dots...
1. How to determine a downtrend.
2. How to determine an uptrend.
3. How to determine when a market is making a change of direction.
One of the key components I look for is how a market closes on a Friday or the last trading day of the week. This is when traders have to decide what they want to do with their positions. It also tells you with a high degree of probability which way the market is headed for the upcoming week. I learned this trading secret on the floor of the exchange in Chicago and it is one I would like to share with you today. I feel that this technique has a lot of validity, particularly in light of today's volatile markets.
Adam Hewison
President, INO.com
Co-Creator of MarketClub
By INO.com
INO and Quote Providers furnish quotes and market analysis without responsibility for accuracy and is accepted by the site visitor on the condition that transmission or omissions shall not be made the basis for any claim, demand or cause for action. The information and data was obtained from sources believed to be reliable, but we do not guarantee its accuracy. Neither the information, nor any opinion expressed, constitutes a solicitation of the purchase or sale of any futures or options..
INO Archive |
© 2005-2022 http://www.MarketOracle.co.uk - The Market Oracle is a FREE Daily Financial Markets Analysis & Forecasting online publication.


