Stocks Bear Market When Will it End?
Stock-Markets / Stocks Bear Market Dec 05, 2008 - 07:55 AM GMTBy: Donald_W_Dony

 The importance of reviewing leading indicators Analysts, market pundits and the financial media are all looking for evidence of the current bear market bottom. Many forecasts from market experts have been announced over the past few weeks that a low may have already been established in the S&P 500. The rational for this statement covers the range from the historical decline percentage of bear markets over the past 60 years, the much quoted TED spread and its recent narrowing, the all-time high of the volatility index (VIX) and attractive valuations on many, many stocks.
Those these indexes and indicators represent key market data, they unfortunately do not address the largest single component of the economy and a necessary element for any new bull market; the consumer.
Value-based analysts have continually commented over the last six months that many outstanding companies are selling at attractive and compelling valuations. Though this is true, the argument can be made that, as the economy has likely another 12-18 months of expected contraction coming, prices will be even better by late 2009.

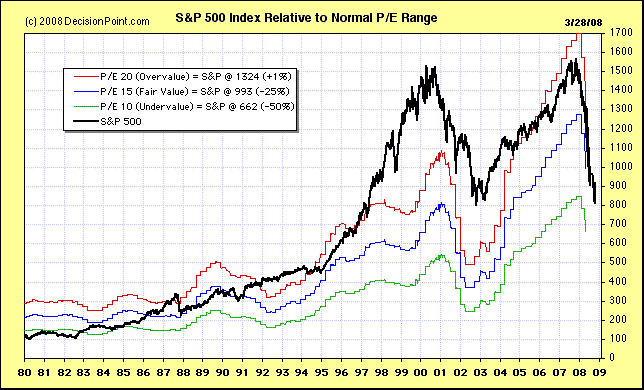
Long-term valuation models (Chart 1) seem to support this idea. With the S&P 500 at approximately the 800 level, this represents slightly less than fair value. It is not until the index trades in the mid-600 range that true attractive or undervalued can be claimed.

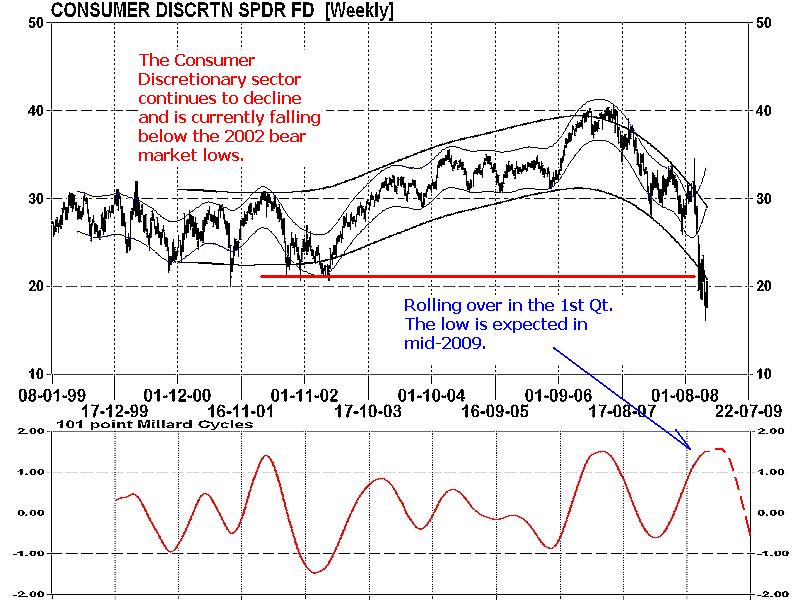
Another key component of every fledgling bull market is the shift in consumer spending out of defensive staples and into the discretionaries. Chart 2 illustrates that this all important change in the consumers spending habits has not occurred yet. Models are indicating that this sector is expected to decline further in early 2009 and potentially reach a low in mid-2009. Another key observation is that this group of companies has broken down through the previous bear market low in 2002. This technical signal is negative and points to lower numbers in the future.

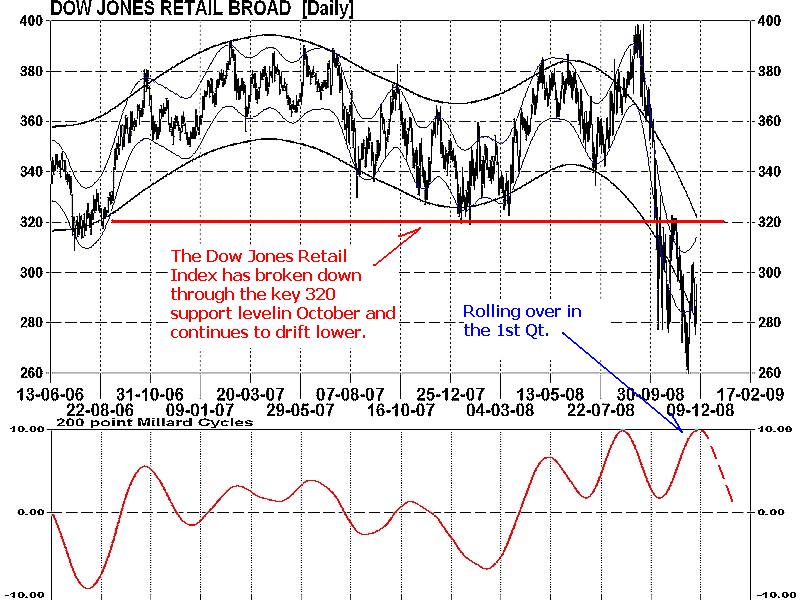
The Dow Jones Retail Index, a broader view of consumer spending, is also echoing a similar tone as the discretionaries. This sector has recently broken technical support (Chart 3) and remains in a deep decline since September. Models are also projecting lower prices in 2009.

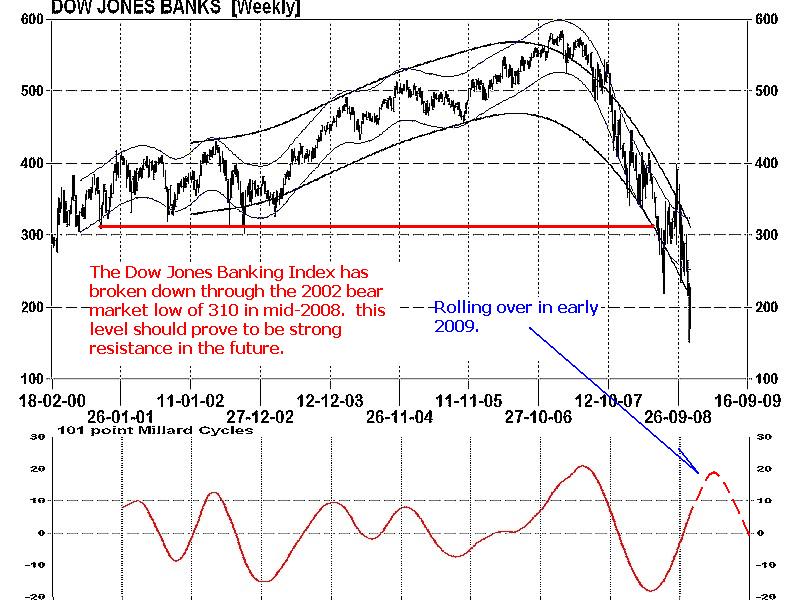
Banks are another important leading indicator of any new bull market. This group is one of the early performers and routinely bottoms out months before the final low in the stock market. Chart 4 illustrates that continued weakness is evident and lower numbers can be anticipated first before any base building will begin. Technical models shows a breakdown through the main 310 support level and a projected low in mid-2009.
Bottom line: Important components of a new bull market are still missing. Consumer spending is withdrawing and the focus remains on the defensive staples and not on the bull market oriented discretionaries. Banks too are showing on going technical weakness with lower number projected in 2009. A bull market can not start until the banks and the consumer is on side and showing support. Long-term fundamental valuations are leaving the window open for additional declines in 2009. With the S&P 500 only at slightly less than fair value at 800 and consumer spending retracting, the expectations of a possible final market low in October or November are unjustly heralded.
More research can be found in the December newsletter. Go to www.technicalspeculator.com and click on member login.
Your comments are always welcomed.
By Donald W. Dony, FCSI, MFTA
www.technicalspeculator.com
COPYRIGHT © 2008 Donald W. Dony
Donald W. Dony, FCSI, MFTA has been in the investment profession for over 20 years, first as a stock broker in the mid 1980's and then as the principal of D. W. Dony and Associates Inc., a financial consulting firm to present. He is the editor and publisher of the Technical Speculator, a monthly international investment newsletter, which specializes in major world equity markets, currencies, bonds and interest rates as well as the precious metals markets.
Donald is also an instructor for the Canadian Securities Institute (CSI). He is often called upon to design technical analysis training programs and to provide teaching to industry professionals on technical analysis at many of Canada's leading brokerage firms. He is a respected specialist in the area of intermarket and cycle analysis and a frequent speaker at investment conferences.
Mr. Dony is a member of the Canadian Society of Technical Analysts (CSTA) and the International Federation of Technical Analysts (IFTA).
Donald W. Dony Archive |
© 2005-2022 http://www.MarketOracle.co.uk - The Market Oracle is a FREE Daily Financial Markets Analysis & Forecasting online publication.


