Yes the FOMC is Predominently Concerned about Inflation, BUT...
Economics / US Economy Apr 13, 2007 - 01:35 PM GMTBy: Paul_L_Kasriel
The Federal Open Market Committee (FOMC) has a baseline forecast that real Gross Domestic Product (GDP) will grow this year somewhat below the economy's potential growth rate, which the FOMC perceives to be about 2-3/4%, and core consumer inflation will gradually move lower toward the 2% upper bound of the FOMC's “comfort zone.” That's the baseline forecast. But since the end of January, the FOMC has grown more concerned about inflation overshooting and real economic growth undershooting their respective forecasts.
In a sense, the Fed is caught on the horns of a dual mandate – to promote full employment along with price stability. We believe that this dual-mandate dilemma will be resolved early in the second half of this year. That is, we expect the FOMC to become predominantly more concerned with full employment and less concerned about price stability.
To that point, we have revised down marginally our real GDP forecast for 2007 from last month's update. On a Q4/Q4 basis, we now expect real GDP growth this year to come in at 2.1% vs. our 2.3% forecast last month. The latest Blue Chip Economic Survey consensus forecast is 2.55% growth and the FOMC's February “central tendency” range forecast was 2-3/4% to 3%.
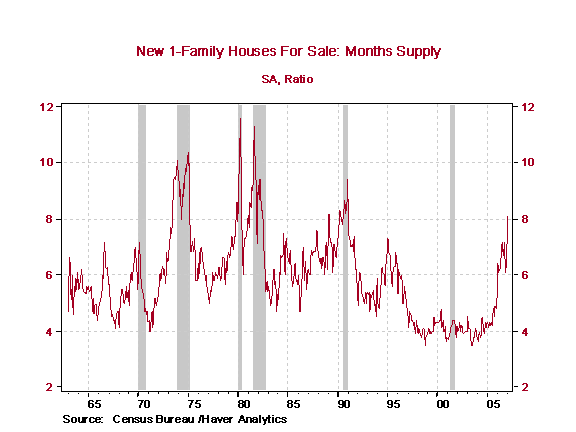
With the exception of the March Employment Situation report, the preponderance of economic reports of late has pointed to real growth below the FOMC's central tendency range. The residential real estate sector remains mired in a recession. One homebuilder after another acknowledges that supply continues to exceed demand. Evidence of this is seen in Chart 1 which plots the inventory-to-sales ratio, or months of supply, for single-family new homes. With inventory equal to 8.1 months of the February sales pace, this is the largest excess supply of new houses by this measure since January 1991 – the last housing recession. Even an industry membership organization, the National Association of Realtors, has conceded that conditions in the sector remain dismal, as evidenced by its forecast that existing single-family home prices will decline nationally in 2007 – the first such occurrence since the Great Depression of the 1930s.
Chart 1
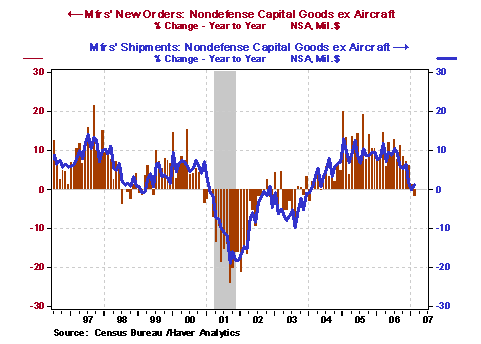
But housing remaining in a recession is old news. The new news is that business capital spending appears to be swooning. In the fourth quarter last year, real spending on business equipment and software contracted an annual rate of 4.8%. The January-February average of shipments in price-adjusted terms of nondefense capital goods excluding aircraft, a proxy for business equipment/software spending, ran at an annualized rate of minus 12.0% vs. the previous quarter's average. This suggests that first-quarter business capital spending also will be down. And to the degree that new orders tell us anything about future capital spending, the news here for the second quarter is discouraging, too. The January-February average of new orders in price-adjusted terms for nondefense capital goods excluding aircraft ran at an annualized rate of minus 21.7% vs. the previous quarter's average. Pictorially, you can see the recent sharp deterioration in business equipment spending in Chart 2, which plots the year-over-year percent change in both new orders and shipments of nominal nondefense capital goods ex aircraft. This relatively sudden weakness in business capital spending is what has created some concern among FOMC members about below-forecast real economic growth.
Chart 2
The shoe that has yet to drop, but is showing signs of doing so, is consumer spending. Motor vehicle sales have been successively lower in each of the past three months. Although January saw a relatively strong price-adjusted 0.4% increase in the purchases of consumer goods – used cars, new trucks, private airplanes, boats, furniture, flat screen televisions and men's clothing – February's price-adjusted expenditures on combined durable and nondurable goods gave back a large chunk of it, contracting 0.3%. Year-over-year increases in March chain store sales were impressive, but largely because Easter was a week earlier this year compared with last year. However, MasterCard's SpendingPulse index of non-auto nominal seasonally-adjusted retail sales for March was less impressive, rising only 0.3% month-to-month vs. February's 0.2% gain. Although we are forecasting a healthy 3.5% annualized growth in real consumer expenditures, including services, for the first quarter, this would be slower than the fourth quarter's 4.2% growth. More importantly, as things now stand, the quarterly-averaging arithmetic points to second-quarter growth in real consumption expenditures below 3.0%.
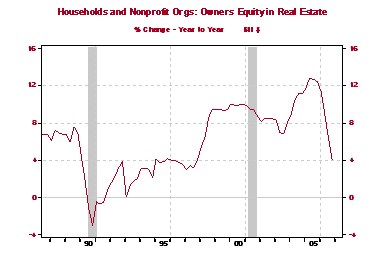
We believe it will be more than just quarterly-averaging arithmetic that will cause weaker growth in consumer spending going forward. Falling house prices are one fundamental factor that is expected to brake consumer spending is. An important source of funding for household deficit spending has been mortgage equity withdrawal (MEW). With house prices falling, growth in homeowners' equity is slowing sharply, as shown in Chart 3. With this slowdown in the growth of homeowners' equity, in combination with the tightening of mortgage lending standards, most of the MEWing that is likely to take place in the coming quarters will be from the family feline.
Chart 3
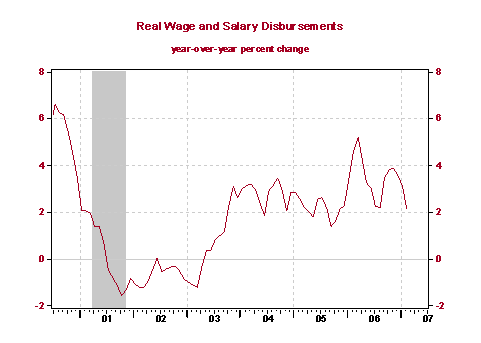
The conventional wisdom is that household employment growth and, therefore, income growth will offset reduced MEW in order to maintain consumer spending. We have some problems with this view. Contrary to popular belief, growth in real wage and salary disbursements on a year-over-year basis tends to lag real personal consumption expenditures. The highest correlation, 0.80, occurs when growth in wage and salary disbursements lags by one quarter (see Chart 4). Perhaps this is why the Conference Board has categorized real personal income, of which wage and salary disbursements are a component, as a coincident indicator rather than a leading indicator. Even if real wage and salary income were a leading indicator, its year-over-year growth is slowing, as shown in Chart 5.
Chart 4
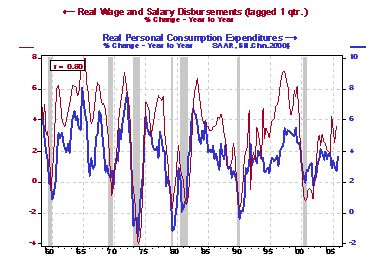
Chart 5
Of course, in addition to the wage rate, the behavior of employment enters into the outlook for wage and salary income. As regular readers of our commentaries know, we are highly skeptical of the monthly Employment Situation data. The data are taken from samples, not universes. The respondents in the sample have no incentive to answer correctly. The BLS not only seasonally adjusts the data, but also adjusts employment by estimates of the hiring of new businesses that have recently opened but are not in the sample and the layoffs of businesses that are not in the sample and have recently closed. This is a noble effort by the BLS, but it is not clear that it, or anyone else, has the knowledge to make these business “birth/death” adjustments with much accuracy, especially at cyclical turning points. For example, in the March 2007 report of nonfarm payrolls, the BLS added 128,000 jobs to the seasonally unadjusted total as an estimate of hiring from new business formations. With economic growth slowing and small businesses becoming pessimistic (see Chart 6), could there be fewer new businesses opening than some mechanistic BLS model assumes?
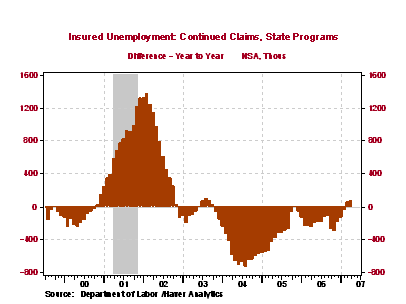
We prefer to judge the state of the labor market by the number of people collecting unemployment insurance. These people are not a figment of the imagination of some BLS statistician, but real folks who have an incentive to be counted. And, on a year-over-year basis, more of them have been counted in February and March (see Chart 7).
Chart 6
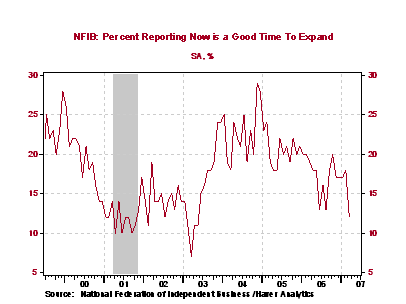
Chart 7
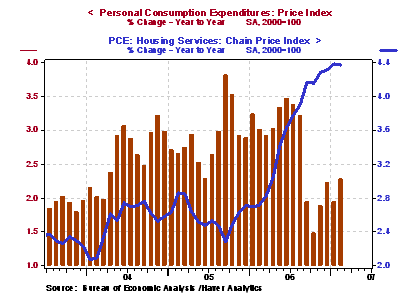
After moderating earlier in the year, the core rate of consumer inflation has re-accelerated. An important element of the rising consumer core inflation rate is the cost of housing services – primarily the explicit rent on apartments and the implicit rent on owner-occupied dwellings (see Chart 8).
Chart 8
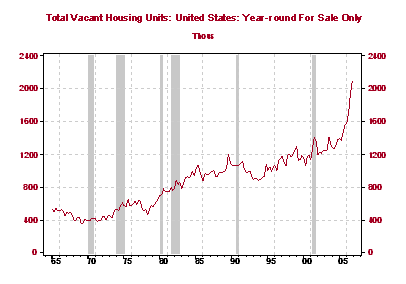
What are the prospects for rent increases in the coming quarters? Given the record 2.1 million empty houses and condominiums for sale at the end of last year (see Chart 9), we would bet that the rate of increase in rents will be moderating. A flipper turned “investor” sitting on an empty condo with mortgage payments, taxes, insurance and condo association fees to pay each month is likely to offer a below-market rent in order to quickly secure a tenant to alleviate the cash-flow drain.
Chart 9
Lastly, inflation is a lagging economic process, as shown in Chart 10. We guess that is why the Conference Board statisticians decided to put an inflation measure in the index of Lagging Indicators rather than the index of Leading Economic Indicators.
Chart 10
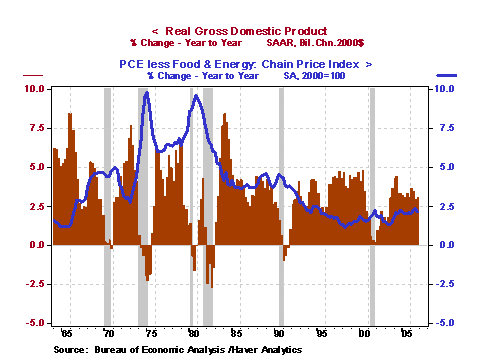
In sum, we believe that by midyear it will become abundantly clear to the FOMC that real economic growth has slowed to “stall speed.” Although core consumer inflation is likely to still be above 2%, it probably will be moving back down. Being aware that inflation is a lagging process, at that point, the FOMC will begin to seriously consider taking out some anti-recession policy insurance. By the August 7 FOMC meeting, after a weak second-quarter real GDP growth report, the FOMC will opt to cut the federal funds rate by 25 basis points to 5.00%.
*Paul Kasriel is the recipient of the 2006 Lawrence R. Klein Award for Blue Chip Forecasting Accuracy
By Paul Kasriel
The Northern Trust Company
Economic Research Department - Daily Global Commentary
Paul joined the economic research unit of The Northern Trust Company in 1986 as Vice President and Economist, being named Senior Vice President and Director of Economic Research in 2000. His economic and interest rate forecasts are used both internally and by clients. The accuracy of the Economic Research Department's forecasts has consistently been highly-ranked in the Blue Chip survey of about 50 forecasters over the years. To that point, Paul received the prestigious 2006 Lawrence R. Klein Award for having the most accurate economic forecast among the Blue Chip survey participants for the years 2002 through 2005.
The opinions expressed herein are those of the author and do not necessarily represent the views of The Northern Trust Company. The Northern Trust Company does not warrant the accuracy or completeness of information contained herein, such information is subject to change and is not intended to influence your investment decisions.
© 2005-2022 http://www.MarketOracle.co.uk - The Market Oracle is a FREE Daily Financial Markets Analysis & Forecasting online publication.


