UK Government Debt to Double, Tax Rises to Follow Tax Cuts
Economics / UK Economy Nov 24, 2008 - 12:45 PM GMTBy: Nadeem_Walayat

 Alistair Darling's emergency tax cutting budget revealed the true extent of anticipated government borrowing that looks set to take official public sector next debt smashing through £1 trillion, this despite the fact that the official data ignores the £500 billion bailout of the banks. The government also announced fantasy growth forecasts that stated that UK GDP growth would return to trend growth of 2.5% per annum by 2011, this leaves more probable forecast growth rates of 0.6% for 2010 far behind and opens up a potential black hole in Britain's finances that implies that actual official government borrowing will be some 50% higher than today's electioneering budget's forecasts.
Emergency Budget 2008
GDP Forecasts - 2009 1% contraction, 2010 1.75% growth,
Borrowing Forecasts - 2008 £78bn, 2009 £118bn, 2010 £105bn, 2011 £87bn, 2012 £70bn, 2013 £54bn
Tax Cuts / Spending
- VAT from 17.5% to 15% for 13 months then reverts back to 17.5%
- Tax Allowance of £120 made permanent
- Pension credit increased from £124 week to £130 per week.
- Pensioners £60 one off payment
- Child Benefit and State Pension increases brought forward to January
- 1% small business tax rise delayed until 2010.
Tax Rises After the Next Election
- National Insurance increases by 0.5%
- 45% Tax rate on those earning above £150k per annum.
Analysis
Credit Crisis - None of the above measures impact on the current economic crisis which is a function of the frozen credit markets as a consequence of the deleveraging of the $500 trillion derivatives market, which is resulting in huge losses that sit off the banks balance sheets that's has effectively resulted in most of the worlds major banks being bankrupt and requiring governments to bail them out. Therefore all of the money spent today is wasted as it does not address the cause of the economic crisis.
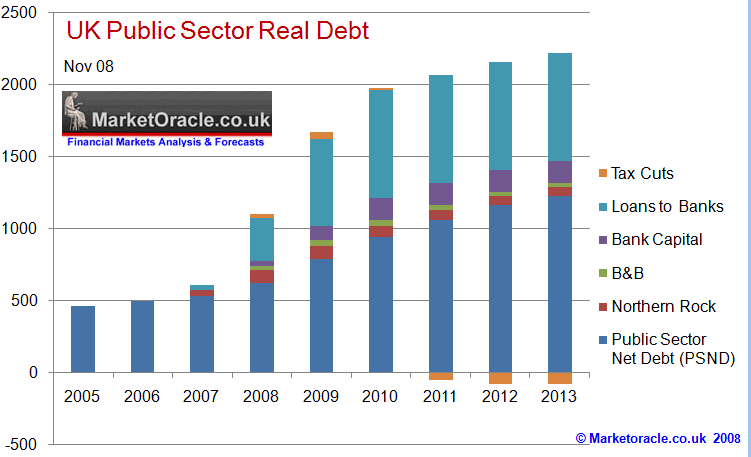
Government Borrowing - The government has today announced that official public sector debt will rise by £503 billion over the next 5 years, which will take debt from £534 billion at the end of 2007 to £1,037 billion by the end of 2013. The borrowing forecast is highly optimistic and is based on growth recovering by 2010, towards trend of 2.5% by 2011. Based on past performance the government has been consistently wrong in forecasting the level of debt where under 'normal' circumstances annual borrowing tends to come in at some 50% higher than forecast. This implies borrowing of £750 billion by 2013, which more than doubles government debt. However this EXCLUDES the vast majority of the government bailout of the banks as loans and loan guarantees are not included, nor are the nationalisations of Bradford and Bingley and Northern Rock.
Record Level of Real Government Borrowing
The actual amount of additional government borrowing is expected to be 50% higher than the forecast of £500billion by 2013, at some £750 billion. On top of this the government has bailed out the banking sector to the tune of £500 billion and incurred nationalisation debt of an additional £120 billion, all of which contributes towards the true extend of government borrowing, despite off the balance sheet accounting practices the government utilises to hide these facts. The total UK Real debt is expected to rise from £534 billion in 2007 to £2,140 billion by the end of 2013 as the below graph illustrates.

Tax Cuts to Revert to Tax Rises
Today's correctly anticipated £20 billion of tax cuts will soon be added to further tax cuts of £20 billion in March 2009 which will eventually turn into a tax hike of £75 billion by 2012 as the government is forced to address the gap between spending and revenues by borrowings, as the more the government borrows, the harder it will become to sell further gilts on the bond market as foreign investors increasingly lose confidence in government bonds and sterling, which means much higher interest rates necessary to finance rampant government borrowing.
Exploding Debt Meets Contracting GDP
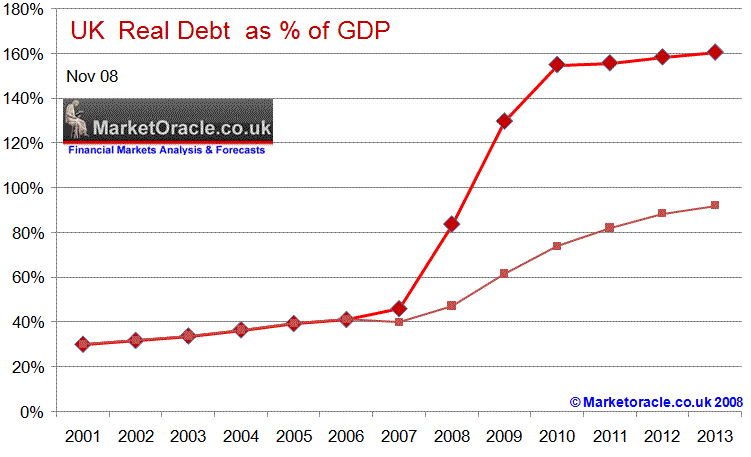
The governments forecasts on debt and GDP are consistently wrong, the original forecast was for 2.5% of GDP for both 2008 and 2009, in actual fact 2008 looks set to hit 0.5% and 2009 see contraction of 2%. Therefore the governments projections for 2009 of -1% and 2010 of +1.5% with trend growth in subsequent years of 2.5% is highly optimistic, and appears to have all the hallmarks of electioneering estimates. The lack of growth will have the effect of increasing the amount borrowed by 50% as mentioned earlier. This would put the governments official public sector debt as a % of GDP at 92% of GDP by the end of 2013. However if all of the bank bailout costs including nationalisations and loans are included this would put debt at 161% of GDP as the below graph illustrates.

Deflation Now Inflation Later
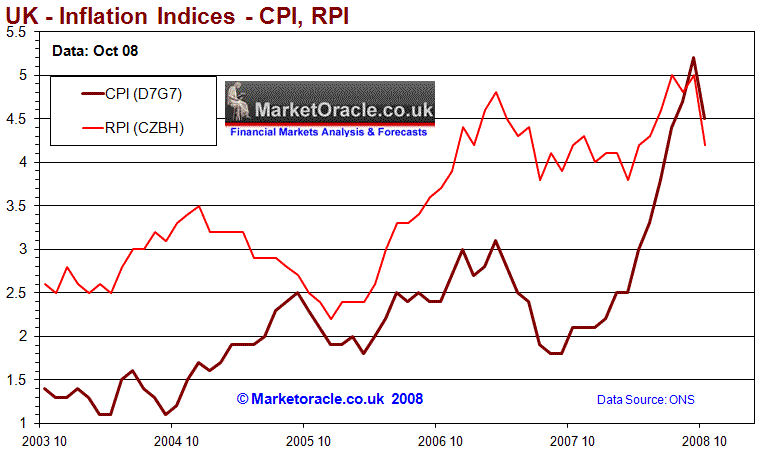
UK inflation as measured by the CPI slumped by the largest amount since the series began in 1997, falling from 5.2% to 4.5%. This follows hard on the heels of the Bank of England's panic 1.5% interest rate cut earlier in the month which was accompanied by BOE statements that UK economy would contract by 2% GDP during 2009, that puts the UK on target to experience a worse recession than that of the early 1990's as Gordon Browns boom turns to bust. The RPI measure which the BoE also warned was heading towards deflation i.e. a negative RPI during 2009 fell sharply from 5% to 4.2%.

Deflation has not been seen in the UK since the 1930's Great Depression. The effect of deflation are worse than inflation as a deflationary spiral brings investment to a halt and the value of debts increases in real terms as wages contract, leaving borrowers worse off than people have experienced during the previous recessions of the post war period. The deflationary trend of late 2008 and 2009 was first warned of by myself way back in March 2008 - DELEVERAGING- Gold and Commodities Teetering on the Brink of a Bear Market? , the trend for which is now coming to pass as virtually all commodities have slumped following their forecast summer peaks.
Retail Sales Deflation
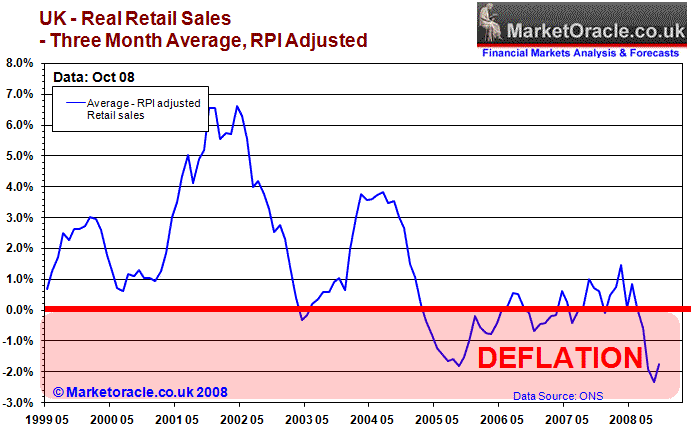
Whilst official data suggests positive retail sales of 2% year on year as though everything remains rosy on the high streets, the real state of the UK high street as per trend and inflation adjusted data illustrates a slump in retail sales activity that is contracting at the rate of -1.8% year on year and reflects the actual state of the retail sales market. This trend is expected to continue deteriorating for the duration of the recession as more retailers report losses and in fact go out of business.

More Bargains Coming for Shoppers
The outbreak of panic sales of 20% plus off marks just the first stage of the consumer bust of 2009. Shoppers can expect more discounting the closer we get to Christmas, followed by deeper cuts during the January sales and later in 2009 by the 70% to 80% price cuts in the CLOSING DOWN SALES as many retailers go bust
Stagflationary Noose Around Britain's Neck
Unlike the 1990's the continuing crash in sterling will not be met by government intervention as the lessons have been learned that the government cannot beat the market, as George Soros illustrated during Sterling's ejection from the Exchange Rate Mechanism, therefore the decline in sterling will be sustained until the economy strengthens in relative terms and the debt has been brought down inline with other major countries.
However the risk is that foreign investors take fright at the soaring amount of government debt being sold i.e. government bonds and stop buying gilts, which would send interest rates soaring and the currency plunging, igniting hyper inflation, which would put is more or less on a similar path to Iceland, where the country has come to a standstill in economic terms as no one wants to do business in the Icelandic Krona so the country is unable to import goods necessary for its survival triggering a downward hyperinflationary economic spiral in which Icelanders are witnessing their life savings all but wiped out.
The record amount of debt will act as a noose around Britain's economic neck for many years, therefore the deflationary bust of 2009 looks set to be followed by much higher inflation than anyone at this time is forecasting, especially the Bank of England which forecasts CPI inflation of 1% during 2010. The UK appears destined for much higher inflation, interest rates coupled with much lower economic growth for the foreseeable future, i.e. the next decade. This will impact on investment performance and the exchange rate weakness implying a sustained loss of value of UK PLC.More on the prospects for inflation in the imminent publication of the Market Oracle UK inflation forecast for 2009-2010, to receive this and other forecasts in your inbox subscribe to our always free newsletter.
UK Election Mid 2009
The current severe deflationary price trend has given the Labour government a window of opportunity to embark on an electioneering spending binge without worrying about the immediate consequences in terms of igniting inflation.
Although tax cuts and stimulus packages are at best only likely to delay the evitable by giving a short lived lift to the economy and feel good factor for traditional labour voters i.e. from the low paid to middle England. Therefore this suggests a last throw of the dice by Gordon Brown's gamble on riding the consumer spending wave into an mid 2009 election probably during April or May 2009 , as neither today's£20 billion give away, nor the further £20 billion package of March 2009 will be able to prevent the inevitable bust.
As mentioned earlier a delayed election into mid 2010 would imply far higher government borrowing with the associated risk of igniting a collapse in sterling and a hyper inflationary bust in subsequent years, which strongly suggests that Gordon Brown is eyeing an Mid 2009 election as the electorate will have by then been doused with some £40 to £50 billion of give away's, rather than attempting to boost the economy into June 2010 that would cost an estimated extra £300 billion in both government spending and support of the financial sector.
However at this point in time there exists no election speculation amongst the labour party circles, which is not surprising given the fiasco of October 2007, when Gordon Brown led the country to believe there would be an election only to bottle out later. This time the strategy is to lay the ground for an mid 2009 election whilst denying any speculation surrounding an election. So silence or denials of an election this early on are not to be taken seriously.
Savers Will Pay the Price for Government Borrowing
Whichever government wins the next general election, they will be forced into taking measures to bring government borrowing under control to avoid igniting hyper inflation that will destroy the value of savings much as occurred during the 1970's. British savers have already witnessed a loss of value of savings of as much as 20% this year despite receiving interest rate payments of as much as 7% due to the crash in sterling which will filter through into higher headline inflation.
By Nadeem Walayat
http://www.marketoracle.co.uk
Copyright © 2005-08 Marketoracle.co.uk (Market Oracle Ltd). All rights reserved.
Nadeem Walayat has over 20 years experience of trading derivatives, portfolio management and analysing the financial markets, including one of few who both anticipated and Beat the 1987 Crash. Nadeem's forward looking analysis specialises on the housing market and interest rates. Nadeem is the Editor of The Market Oracle, a FREE Daily Financial Markets Analysis & Forecasting online publication. We present in-depth analysis from over 150 experienced analysts on a range of views of the probable direction of the financial markets. Thus enabling our readers to arrive at an informed opinion on future market direction. http://www.marketoracle.co.uk
Disclaimer: The above is a matter of opinion provided for general information purposes only and is not intended as investment advice. Information and analysis above are derived from sources and utilising methods believed to be reliable, but we cannot accept responsibility for any trading losses you may incur as a result of this analysis. Individuals should consult with their personal financial advisors before engaging in any trading activities.
Attention Editors and Publishers! - You have permission to republish THIS article. Republished articles must include attribution to the author and links back to the http://www.marketoracle.co.uk . Please send an email to republish@marketoracle.co.uk, to include a link to the published article.
Nadeem Walayat Archive |
© 2005-2022 http://www.MarketOracle.co.uk - The Market Oracle is a FREE Daily Financial Markets Analysis & Forecasting online publication.


