


Gold Upside Breakout Projects to $930
Commodities / Gold & Silver Nov 23, 2008 - 05:05 PM GMTBy: Merv_Burak

 WOW! Friday was the best day since mid-Sept. We could use more of them but the Mid-Sept one didn't go very far so I wonder if this one will. One day does not make a reversal. I'd like to see many $10 up days rather than one $50 day.
GOLD
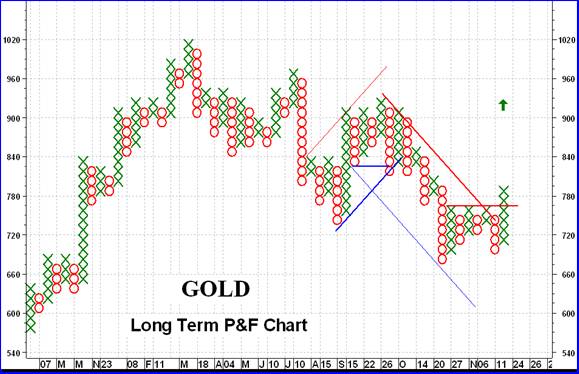
As the long term P&F chart shows, the Friday action gave us an upside break-out and a bull signal. However, before we get too bullish on this move one is restrained by the fact that the break only projects to the previous high (at $930) from the Sept-Oct action. This lack of a significantly high projection suggest that the break may not have that much real strength behind it and may not even reach that previous high. We will just have to take it one day at a time until we get some additional and stronger confirmation of the new move.
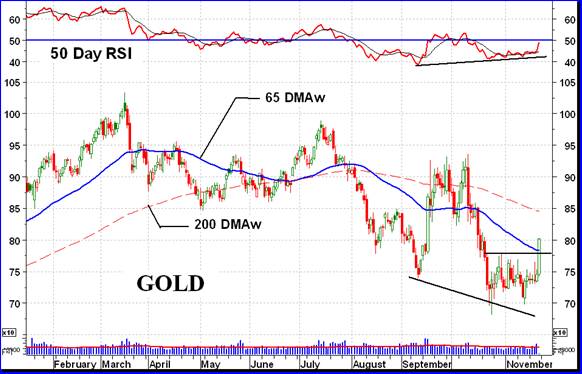
Going to the normal chart and indicators, things are not yet so rosy. Gold remains below its negative sloping moving average line despite the sharp advance on Friday. The momentum indicator is moving upwards and is above its positive trigger line but is still slightly in its negative zone. The volume indicator is also moving upwards but is still slightly below its negative sloping trigger line. Putting all that together, the long term is still rated as BEARISH but the rating could start improving with another day or two of good upside action.
INTERMEDIATE TERM
I guess the latest move upwards could have been expected with that significant positive divergence shown on the momentum indicator. Friday's sharp move, although closing above the intermediate term moving average line, had not quite turned the line to the up side. The moving average has turned but so far only to the horizontal. As for momentum, the positive divergence was giving us a warning of a possible upside move but the action has not yet taken the momentum indicator to the positive zone. It is above its positive trigger line, however. The volume indicator is still moving in a lateral direction and under performing the gold price move. It is presently sitting right on its negative sloping trigger line but that is based upon data only to the Thursday's action. With the Friday's action it most likely has broken above the trigger but without knowing the amount of volume it is difficult to assess if the trigger line had turned upwards at the same time. The rating is moving towards the bullish side but has not quite reached that point. For today the rating has improved but only to the + NEUTRAL level.
SHORT TERM
With the Friday's action all short term indicators had turned positive. No need to go into any great detail. Even the very short term moving average line has crossed above the short term one confirming the short term rating as BULLISH .
As for the immediate direction of least resistance, Surprise! That is to the up side. A rally may still continue for a little longer as the Stochastic Oscillator has not quite entered its overbought zone, which is so often the case prior to a reversal.
SILVER
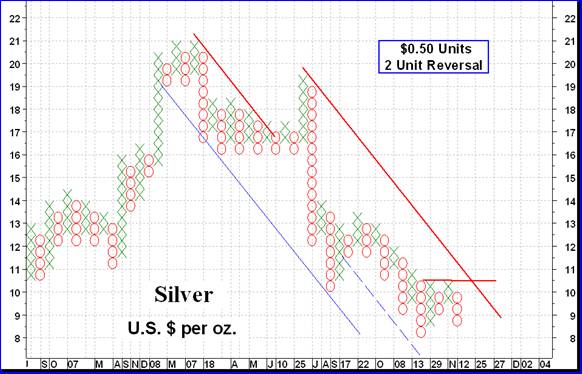
Despite all the articles and comments one reads in the financial media to the fact that silver should be in greater demand than gold the action of silver bullion continues to under perform that of gold. While Friday's action in gold has taken that metal above recent highs the action in silver seems to be just the opposite. Although not into new lows silver is hovering not far above its lows. The P&F chart shows quite emphatically the difference in silver action versus gold. Friday's action was on the up side but the close was still nowhere near reaching even the earlier November high. It is still at least $1.00 below that point. For now silver is under performing gold and from all indications will continue to under perform. At some point in time silver may start to out perform gold but we'll just have to wait for that time and not assume it is here or nearly here.
PRECIOUS METAL STOCKS
Although it's nice to know what the metals are doing most individuals are probably much more interested in knowing what the stocks are doing. This week was interesting in stock trading in that we had a wide divergence depending upon the “quality” of the stocks. Both the highest quality and lowest quality were on the move, but in opposite directions. Overall, the average price of a component stock in the Merv's Gold & Silver 160 Index lost 1.1%. Within that figure we have the 30 highest quality stocks (Merv's Qual-Gold Index) gaining 9.8% while the lowest quality stocks (Merv's Gamb-Gold Index) losing 9.4%. The mid-tier stocks (Merv's Spec-Gold Index) just about broke even with a minor gain of 0.9%. Going to the specific silver stocks, they were worse off than gold. The quality silver stocks (Merv's Qual-Gold Index) lost 3.3% while the more speculative silver stocks (Merv's Spec-Silver Index) lost 7.8%.
Looking at the Table of Precious Metal Indices below, the major North American Indices seem to have significantly out performed the Merv's Indices. This is primarily due to the weighting method of calculating these Indices value, giving a much greater weight to the largest companies (which this week were the real weekly winners) and next to no weight to the smaller companies (which in general declined or had only small upside movement) in their Indices. In the case of the S&P/TSX Global Gold Index, its super performance was helped by a more than 5% decline in the value of the Canadian Dollar versus the US Dollar.
Most speculators should understand that one super day of upside action does not make a trend. In fact, one should be extra cautious about super action days like Friday. Looking at my data for the 160 component stocks of the 160 Index the summation of bullish and bearish ratings has improved but in no time period has it improved to the point of going over the 50% positive figure to give us a majority bullish rating. Using daily indicators rather than the weekly ones used for the Tables of Technical Info, the overall ratings on the short term at 38% BULL and 54% BEAR. On the intermediate term these ratings become 10% BULL and 86% BEAR. On the long term we have only 3% BULL and 97% BEAR. As you see, the ratings for the intermediate and long term still have a long way to go for the market to say we are into a new bull market. Of course the ratings will change first in the short term and here we are getting closer to a bullish rating but even here we are not there yet. Gamblers may be getting ready to gamble their capital or may already be at it, but they do so at a far greater risk than the speculator who is still waiting for better confirmation of a new trend.
Merv's Precious Metals Indices Table
Let's call it another week.
By Merv Burak, CMT
Hudson Aero/Systems Inc.
Technical Information Group
for Merv's Precious Metals Central
For DAILY Uranium stock commentary and WEEKLY Uranium market update check out my new Technically Uranium with Merv blog at http://techuranium.blogspot.com .
During the day Merv practices his engineering profession as a Consulting Aerospace Engineer. Once the sun goes down and night descends upon the earth Merv dons his other hat as a Chartered Market Technician ( CMT ) and tries to decipher what's going on in the securities markets. As an underground surveyor in the gold mines of Canada 's Northwest Territories in his youth, Merv has a soft spot for the gold industry and has developed several Gold Indices reflecting different aspects of the industry. As a basically lazy individual Merv's driving focus is to KEEP IT SIMPLE .
To find out more about Merv's various Gold Indices and component stocks, please visit http://preciousmetalscentral.com . There you will find samples of the Indices and their component stocks plus other publications of interest to gold investors.
Before you invest, Always check your market timing with a Qualified Professional Market Technician
Merv Burak Archive |
© 2005-2022 http://www.MarketOracle.co.uk - The Market Oracle is a FREE Daily Financial Markets Analysis & Forecasting online publication.