


Why the Stock Market Keeps Falling Despite Value Bargains
Stock-Markets / Stocks Bear Market Nov 21, 2008 - 12:27 PM GMTBy: Marty_Chenard

 Some investors are noting that there are some significant "value bargains" appearing on the radar screen, and yet, the market is ignoring this and still moving down .
What's going on?
The current down move is part of a huge " move to liquidity panic " going on now. Global investors are moving out of illiquid assets and into liquid assets.
This morning, we will share that chart with you so that you have a sense of the magnitude of the Liquidity outflows in the stock market. (Liquidity moving in or out of the stock market is something we monitor every day on our paid subscriber site: Section 4, Charts 8-1 and 8-2.)
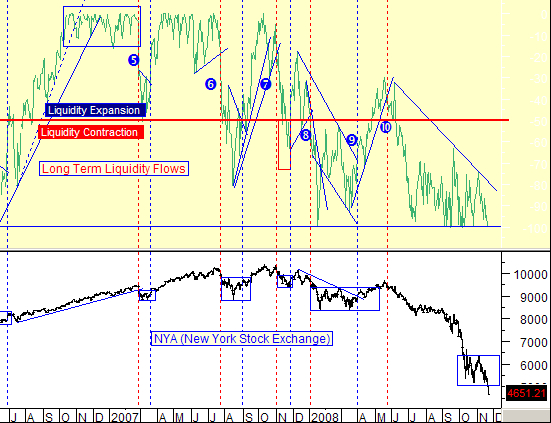
Today's first chart shows the Long Term Liquidity flows picture. Long Term Liquidity is a measurement of Liquidity Injections flowing into the market ... or lack thereof.
Liquidity Expansion means that money inflows are at an expansionary rate which drives the market up. Decelerating Expansion is when the rate of inflows are decreasing while still net positive.
Liquidity Contraction means that money inflows are being withdrawn from the markets at a level which is "net negative", and when this happens, the contraction results in a correction or pull back.
What the chart shows: This past June marked a shift where the Liquidity inflows for the stock market went negative, into Liquidity Contraction . It has been there ever since, and lately, it has been hitting maximum outflow levels on our Liquidity indicator. See the next chart ...
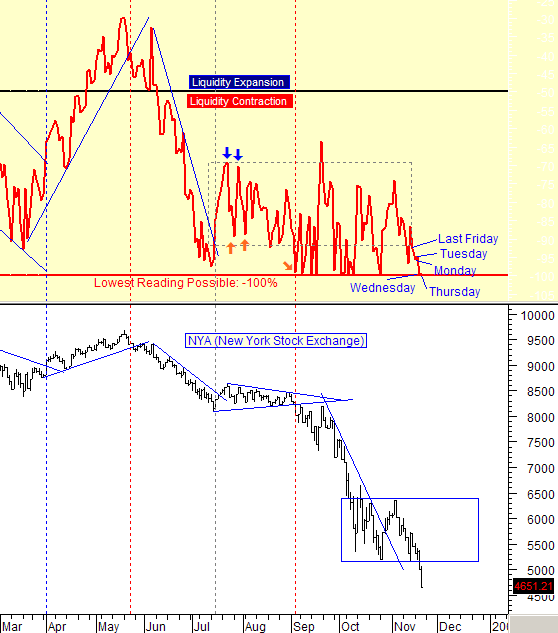
This chart is a close up of the above chart showing the recent action back to March. Note that the Liquidity levels have been mostly in the lower half of the Contraction Territory since August.
On Wednesday and Thursday (yesterday), Liquidity outflows were at their maximum outflow levels. (The bottom red line is the lowest reading possible.)
To reiterate what is going on: The current down move is part of a huge " move to liquidity panic " going on now. Global investors are moving out of illiquid assets and into liquid assets.
Final comments: The market can't go up until this stops.
____________________________________________________________________
*** Feel free to share this page with others by using the "Send this Page to a Friend" link below.
By Marty Chenard
http://www.stocktiming.com/
Please Note: We do not issue Buy or Sell timing recommendations on these Free daily update pages . I hope you understand, that in fairness, our Buy/Sell recommendations and advanced market Models are only available to our paid subscribers on a password required basis. Membership information
Marty Chenard is the Author and Teacher of two Seminar Courses on "Advanced Technical Analysis Investing", Mr. Chenard has been investing for over 30 years. In 2001 when the NASDAQ dropped 24.5%, his personal investment performance for the year was a gain of 57.428%. He is an Advanced Stock Market Technical Analyst that has developed his own proprietary analytical tools. As a result, he was out of the market two weeks before the 1987 Crash in the most recent Bear Market he faxed his Members in March 2000 telling them all to SELL. He is an advanced technical analyst and not an investment advisor, nor a securities broker.
Marty Chenard Archive |
© 2005-2022 http://www.MarketOracle.co.uk - The Market Oracle is a FREE Daily Financial Markets Analysis & Forecasting online publication.