


Current Commodities Price Deflation to be Followed by Massive Inflation Later
Commodities / Inflation Nov 17, 2008 - 10:19 AM GMTBy: Richard_Shaw

 The global economy is declining. As a result, prices of important kinds of “stuff” is falling. Governments are pouring money onto the markets to solve a problem that may have been caused by easy money originally.
If you party too much and awake the next day with a hangover, taking a shot of alcohol may take the immediate pain away. However, it only delays and probably increases the pain when you finally decide to stop drinking, or become so sick you can't drink any more. Taking that morning after drink is referred to as taking a “hair of the dog that bit you”.
Some people are concerned that the US and perhaps some other countries, particularly the UK, may be in the economic functional equivalent of taking a hair of the dog that bit them.
So What?
If that perspective makes sense, then what would be the consequence?
The original easy money caused an asset bubble. The absence of easy money caused a deflation in asset prices (commodities, real estate, stocks and most bonds) — pretty much everything but short-term sovereign debt.
Once the money being poured on begins to move, asset prices will begin to rise again. Then the question is whether all the extra money will make a new asset bubble, leaving governments without remaining tools to deal with a subsequent crisis? Either way inflation, not deflation will be the situation.
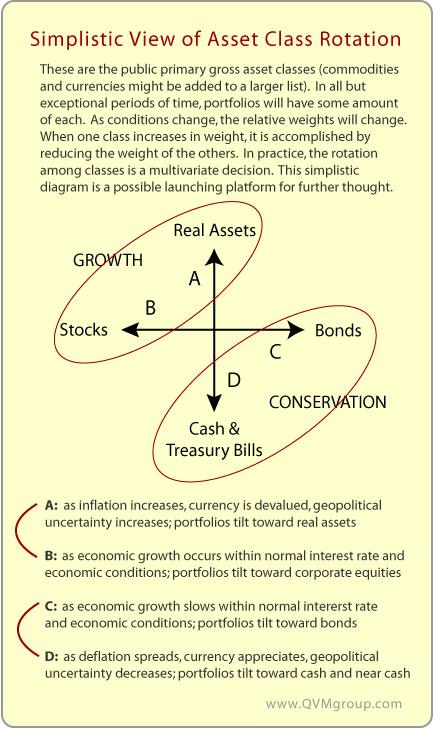
Investment coping strategies during inflation are different than during deflation. Investors need a plan to deal with the eventual change in circumstance. If hyperinflation were to occur, which some fear, all bets are off. If the more likely “normal” or high inflation (not hyperinflation) occurs, shifts in asset class weights are appropriate.
Asset Class Rotation Based on Conditions
Note: We have stated before that we deviated from our core asset allocation, non-market timing approach this summer for assets we control by going substantially to cash before the current unpleasantness. We think standing aside as a train wreck is coming straight at you is not the same as market timing, which we do not practice — it's self-preservation. We think rebalancing a diversified set of asset classes works better than market timing under normal circumstances. This discussion is about re-weighting a fully invested and diversified portfolio, not about going entirely to one class or the other.
Monitoring Prices for Deflation or Inflation
If you are concerned about turning points between deflation and inflation, the CPI is not a good place to look. It's well known to be limited in scope and may also be managed to some degree by the government, which not only is a player (with indexed entitlement programs and inflation indexed bonds), but is also the scorekeeper and the final court of appeals.
The place to look for price level changes is directly at the prices of key items themselves. They'll let you know whether we are in deflation or inflation.
The rate of change of prices (shape of the curve) as well as absolute price levels will inform you.
We would suggest following this basket:
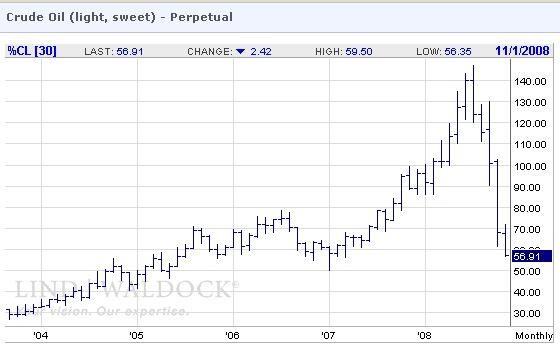
- oil (USO)
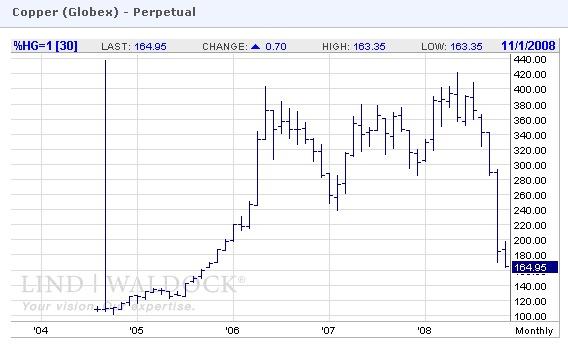
- copper (JJC)
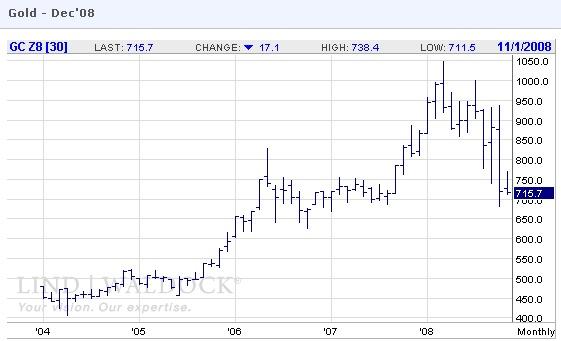
- gold (GLD)
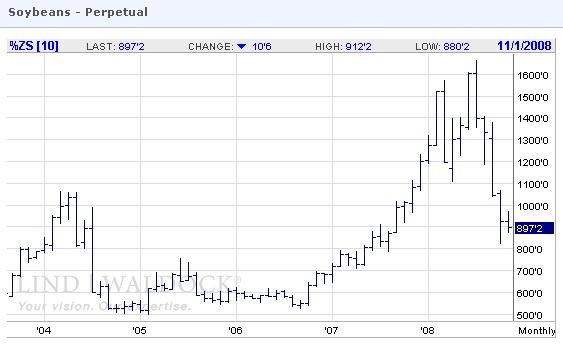
- soybeans (JJG for grains)
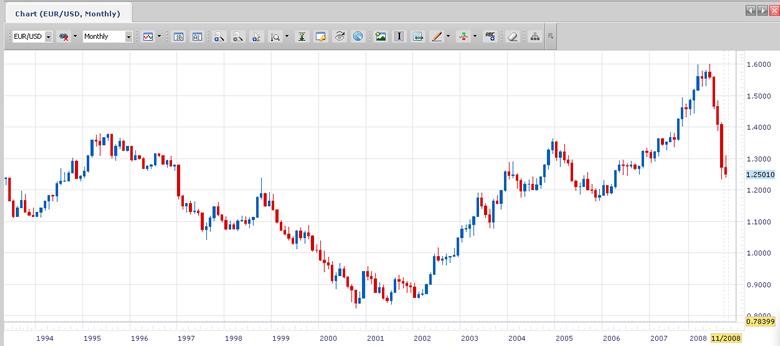
- EUR/USD fx (FXE)
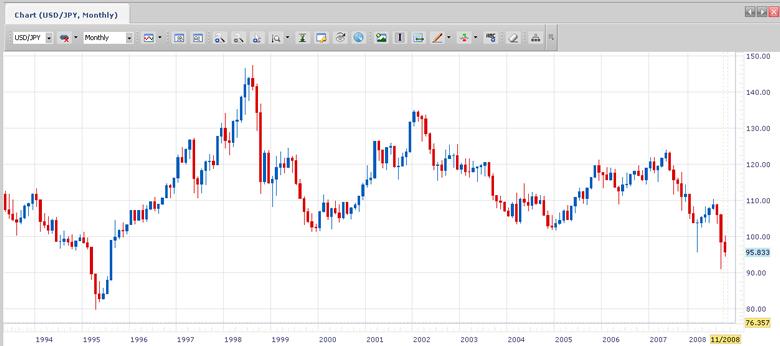
- USD/JPY fx (FXY)
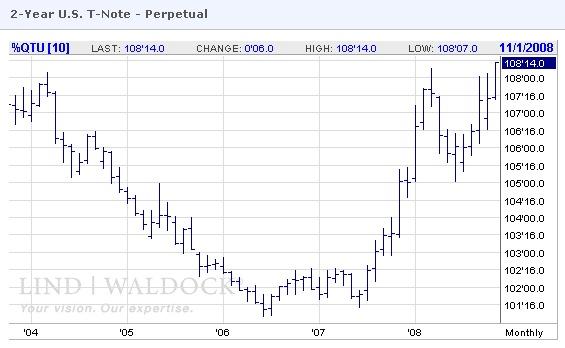
- 2-Year Treasuries (SHY for 1-3 yr T's))
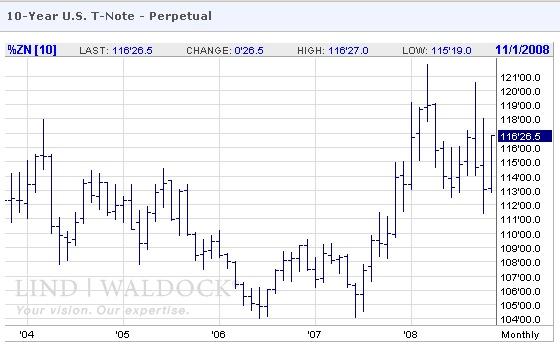
- 10-Year Treasuries (IEF for 7-10 year T's)
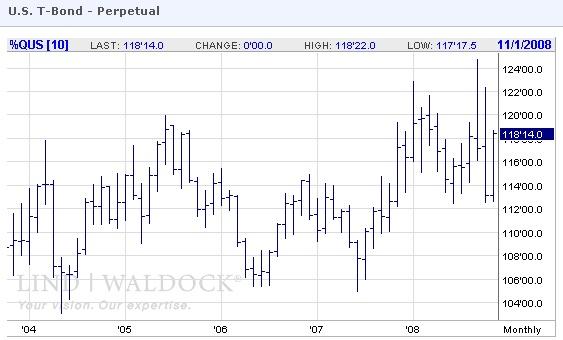
- 30-Year Treasuries (TLT for 20+ year T's)
The charts below are for five-year, monthly, perpetual near-month futures contracts, but stock investors can get a similar view by observing the ETF or ETN listed after each category (not all perfect matches, but reasonably useful if you don't have spot or futures prices available).
Current Situation
There is no inflation, except in the price of Treasuries, particularly short dated Treasuries, as investors flee risk and prize liquidity. The price premium on Treasuries will melt when investors once again move to riskier assets for yield and gain.
We are in a deflationary period. No signs of inflation in these charts.
Gold
Oil
Copper
Soybeans
Euro
(Dollars per Euro - spot fx since 1994)
Dollar becoming stronger vs Euro
Yen
(Yen per Dollar - spot fx since 1994)
Dollar becoming weaker vs Yen
2-Year Treasuries
(up means lower interest rate)
10-Year Treasuries
30-Year Treasuries
By Richard Shaw
http://www.qvmgroup.com
Richard Shaw leads the QVM team as President of QVM Group. Richard has extensive investment industry experience including serving on the board of directors of two large investment management companies, including Aberdeen Asset Management (listed London Stock Exchange) and as a charter investor and director of Lending Tree ( download short professional profile ). He provides portfolio design and management services to individual and corporate clients. He also edits the QVM investment blog. His writings are generally republished by SeekingAlpha and Reuters and are linked to sites such as Kiplinger and Yahoo Finance and other sites. He is a 1970 graduate of Dartmouth College.
Copyright 2006-2008 by QVM Group LLC All rights reserved.
Disclaimer: The above is a matter of opinion and is not intended as investment advice. Information and analysis above are derived from sources and utilizing methods believed reliable, but we cannot accept responsibility for any trading losses you may incur as a result of this analysis. Do your own due diligence.
Richard Shaw Archive |
© 2005-2022 http://www.MarketOracle.co.uk - The Market Oracle is a FREE Daily Financial Markets Analysis & Forecasting online publication.