The Yen Carry Trade Means New Rules for Global Investing in 2007
Stock-Markets / Yen Carry Trade Apr 10, 2007 - 07:03 PM GMTBy: Gary_Dorsch
 Jesse Livermore, widely regarded as one of the greatest stock market operators of all-time, considered himself a humble student of the market until his last day in 1940. “I study the market, because it's my business to trade. In the forty years which I have devoted to making speculation a successful business venture, I am still discovering new rules to apply to that business,” he once remarked.
“Experience has taught me the way a market behaves is an excellent guide for an operator to follow. Observation gives you the best tips of all, and the behavior of a certain market is all you need at times. You observe, and then experience shows you how to profit by variations from the usual, that is to say, from the probable.”
Had Livermore been operating in today's markets, he might have found it intriguing that the direction of the Japanese yen would become a key driver of the Dow Jones Industrials. Traditional indicators such as the health of the US economy, company earnings, cash flow, and future sales forecasts are all taking a backseat to forecasting the direction of the heavily manipulated Japanese yen in the foreign exchange market, in order to predict the Dow Jones Industrials.
The infamous “yen carry” trade, which involves borrowing in Japanese yen at less than 1% to invest in riskier assets like commodities and stocks, has mushroomed to an estimated $500 billion to $800 billion in size. It's made the Bank of Japan, the world's top central banker, and the US Treasury and the Federal Reserve are key collaborators with Tokyo in guiding the dollar /yen and the Dow Jones Industrials.
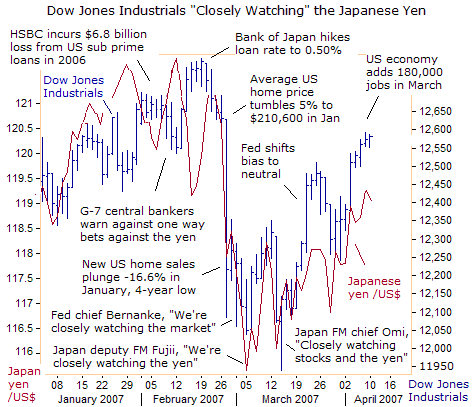
Someday, the Dow Industrials' obsession with the dollar /yen exchange rate will fade into oblivion. But for now, it's the endless flow of cheap capital from Tokyo that is pumping up the DJI Index to record highs, at a time when the US economy is slowing towards zero percent growth, and S&P 500 earnings growth is expected to slow to +6 to 8% YoY in Q'1, after 4-½ years of straight double-digit profit gains.
The DJI's 416-point plunge on February 27th, the seventh largest daily point loss in history, ignited by a sudden plunge in the US dollar from 120.75-yen to 118-yen, is just a fading memory. Five weeks later, the DJI is once again riding high, recouping most of its panic stricken losses from the Feb 27th to March 13th shakeout, the shortest and shallowest correction from a record high in history.
Instead, it's the US dollar's recovery from a low of 115.25-yen on March 5th to 119.25-yen on April 10th that has revived bullish sentiment on Wall Street. Higher stock prices at a time of slowing earnings growth can raise S&P 500 P/E ratios to dangerously high levels. But it's the Bank of Japan's 0.50% overnight loan rate and the Fed's purchases of long-dated bonds in the Treasury market, that are the primary obsession of US and global stock market operators these days.
US Labor Apparatchniks Prop-Up the US Dollar
The “yen carry” trade appears to be a “risk-free” trade, with both the Japanese ministry of finance and the US Treasury working for a stronger dollar against the yen. However, the “yen carry” trade did blow-up on February 27th, from unexpected meltdowns in shares of US sub-prime lenders. Top US mortgage lender Countrywide Financial (CFC.N) extended its recent losses to $32.50 /share on April 2nd, after top sub-prime lender New Century Financial filed for Chapter 11 bankruptcy.
The demise of New Century came less than two months after it had first disclosed problems with delinquent and defaulted loans. It stopped making loans last month, after having made nearly $60 billion in 2006. “Sub-prime woes are not a small issue,” said the 81-year-old former Fed kingpin “Easy” Al Greenspan on March 16th. “Much of the strength in consumer spending over the past five years could be traced to capital gains, both realized and unrealized, on surging housing prices.”
“If home prices keep falling, there could be more of an impact on the broader US economy's momentum,” Greenspan warned. But the US Plunge Protection Team has been working overtime with Japan's ministry of finance, to repair the damage to the global stock markets, by downplaying the risks to the US economy from the sub-prime loan meltdown, and pursuing policies to keep the yen weak.
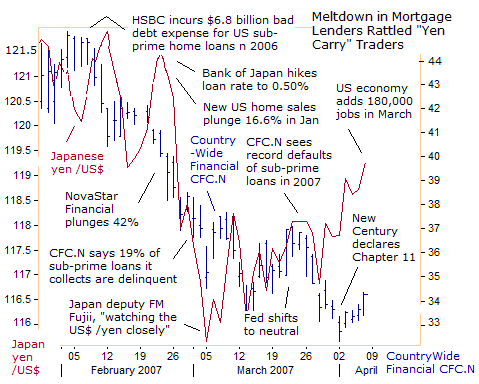
After “closely tracking” the slide CFC.N in February and March, the dollar /yen exchange rate began to diverge from CFC.N in April, as currency traders bet on a rosy US employment report on April 6th. “Observation, experience, and memory, are what a successful trader must depend on. He must not only observe accurately, but remember at all times, what he has observed,” said Livermore.
“He cannot bet on the unreasonable or the unexpected. He must always bet on probabilities and try to anticipate them. Years of practice at the game, of constant study, of always remembering, enable the trader to act on the instant when the unexpected happens, as well as when the expected comes to pass,” said Livermore.
Fuzzy Math and the US Jobs Reports
US Labor apparatchniks have a history of tinkering with employment reports. Last August, Labor revised an original 128,000 increase in payrolls into a gain of 230,000 jobs and September's 51,000 increase was revised upwards to a 148,000 gain. Last November, Labor apparatchniks raised a lot of eyebrows, when their fuzzy math produced an extra 810,000 jobs from April 2005 through March 2006 than originally reported, all with the simple stroke of a pen.
So traders bet correctly, when Labor reported a “stronger-than-expected” 180,000 new jobs for March with the jobless rate slipping to 4.4%, a six year low, implying the US economy remains resilient despite a slowdown in housing. Labor went two steps further and revised upward the estimate for jobs created in January and February by 16,000 each month to 162,000 and 113,000 respectively.
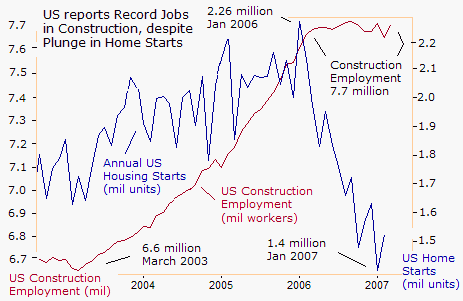
Still, the most glaring irregularity in Labor's latest employment report was a 56,000 increase in construction jobs to a near record 7.7 million workers, and offsetting a decline of 61,000 in February. One might have suspected that the sizeable loss of construction jobs in February was the beginning of a trend, and not a one-time fluke, given the 33% slide in housing starts since January 2006.
Overall, construction jobs have shown no net growth since peaking in September 2006. Until then, the housing industry was the key engine of job growth in the USA, and had accounted for more than half of private payroll jobs created since 2001. But Labor's fuzzy math is not subject to the same audits or accounting standards as home builder's earning reports that will be forthcoming in the weeks ahead.
Labor's claim that US construction employment remains unchanged from a year ago doesn't jive with industry reports. Luxury-home builder Toll Brothers TOL.N said its first-quarter profit dropped 67% from a year ago, and Lennar LEN.N, the #3 home builder, posted a 73.4% plunge in profit, saying the industry's spring selling season has failed to bloom and its outlook for the rest of 2007 does not look bright.
“While some markets are performing better than others, the typically stronger spring selling season has not yet materialized,” said Stuart Miller, Lennar's CEO. “These soft market conditions have been exacerbated by the well-publicized problems in the sub-prime lending market,” he said. It defies all logic that hemorrhaging US home builders are retaining idle workers and not initiating layoffs, as Labor's stats suggest.
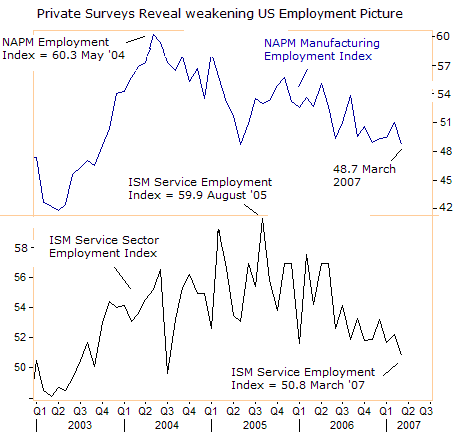
Many bond traders do not trust Labor's fuzzy math, and instead rely on private surveys, such as the NAPM report on manufacturing employment, which showed a contraction in factory jobs in March, matching Labor's claim of a 16,000 job loss. However, the ISM index on service sector employment stood at 50.8 last month, compared with December's 53.1, and August 2005's 59.9, when US home builder share prices topped out, before their 50% year long slide. Together, the private surveys show stagnant to contracting US jobs growth.
Bank of Japan keeps its Powder Dry
The Bank of Japan sat tight on monetary policy on April 10th, reluctant to follow up on its February interest rate hike due to fear of another unwinding the “yen carry” trade. That keeps the overnight call rate target at 0.50% for the second month in a row, in a unanimous vote, and is likely to lead to a clash with European finance ministers at the upcoming April 13th G-7 meeting in Washington.
The BOJ said year-on-year changes in consumer prices are moving around zero percent and are likely to stay there for the near term, reflecting recent falls in crude oil prices. That's led to expectations the BOJ will keep its powder dry at 0.50% until the July-September quarter or possibly longer. But clearly, with Japan's economy expanding at a 5.5% annualized rate in Q'4, the BoJ's overnight loan rate of 0.50% is far out of alignment with the rest of the world, and creating bubbles worldwide.
BOJ hawk Atsushi Mizuno warned on Feb 28th, “The side effects of keeping low interest rates regardless of economic conditions could prompt yen weakness and may increase protectionism among Japan's trading partners. It could also cause distortions in global asset prices by speeding up capital outflows from Japan.
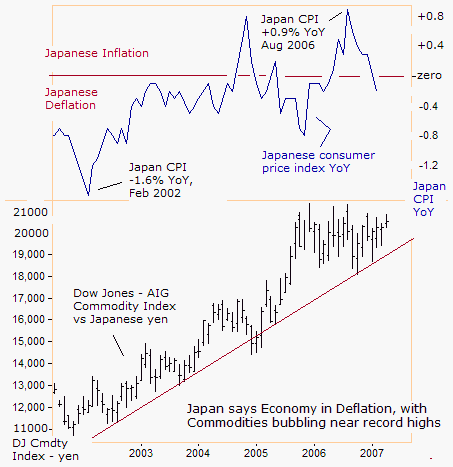
Tokyo's financial warlords are manipulating the inflation data, and claim that Japan is still suffering from deflation, after an 86% surge in the Dow Jones Commodity price Index to 20,500-yen, from five years ago. Last week, Tokyo said consumer prices were -0.2% lower in February from a year earlier, while the rest of the world is grappling with inflation, even according to heavily sedated government statistics.
It might only be a matter of time, until the “yen carry” trade lifts commodity prices to new record highs in Japan. BoJ deputy Toshiro Muto said on April 4th that inflationary pressures will likely increase in the future and the central bank will gradually nudge up interest rates. “As we have said before, we have no predetermined schedule for future policy changes in mind,” he said.
But the ruling LDP party, led by the radical inflationist Shinzo Abe, is staunchly opposed to rate hikes, to keep Japan's debt payments low. As of March 31st, Japan's national debt was $6.7 trillion, and the annual interest expense totaled $177 billion. A 1% increase in 10-year bond yields would push up Tokyo's debt-servicing costs by 1.6 trillion yen ($13.6 billion), the Ministry of Finance has estimated. Debt-servicing costs already eat up about a quarter of spending in the annual budget. So without enormous political pressure from Europe, Tokyo won't budge on interest rates.
Euro /Yen Carry Traders wreck Havoc on ECB
Because of Tokyo's refusal to raise its interest rates, supported by the US Treasury, European central bankers find themselves in a dilemma. The Euro M3 money supply is exploding at a 10% growth rate, and requires a tighter ECB money policy to head-off inflationary pressures in the Euro zone economy. Yet unilateral ECB rate hikes that are not matched by the BoJ could send the “Euro /yen” rate much higher.
European finance ministers are staunchly opposed to Tokyo's cheap yen policy, and drew a line in the sand for the Euro at 160-yen at the Essen G-7 meeting. European finance ministers view Tokyo's weak yen policy as a clandestine attempt to aid Japanese exporters in grabbing market share around the globe at the expense of European exporters. On March 20th, EU finance chief Jean-Claude Juncker said the Japanese yen must reflect the fundamentals of the Japanese economy.
“The fact that the Bank of Japan didn't raise interest rates hardly surprises me,” after the BOJ left its overnight call rate target at 0.50% on March 20th. “I think that some people in Europe and elsewhere had got their hopes up after the recent interest rate rise. We stick to the message that we sent at the Essen G-7 meeting,” Juncker said.
“We think that Japanese growth is without doubt picking up. We think that the exchange rate must reflect the fundamental facts of the Japanese economy. Our Japanese friends know that. And we are watching them,” Juncker warned. But without higher Japanese interest rates, European “jawboning” is losing its potency.
It won't be the first time that Tokyo has broken a pledge to cooperate with the G-7 on foreign currency issues. On Sept 20, 2003, the G-7 finance ministers called for Japan to reduce its sales of the yen, after it had already sold an unprecedented 9-trillion yen ($76.8 billion) from January through July 2003. But Tokyo resumed massive yen sales within a few weeks, dumping 26 trillion yen on the market from November 2003 thru March 2004, to prevent the dollar from tumbling to 100-yen.
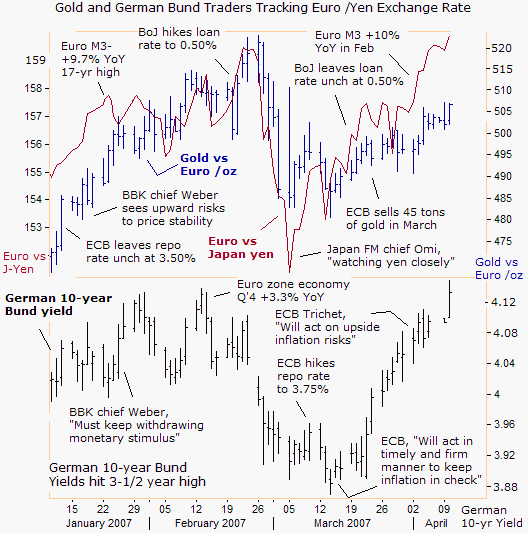
The “Euro /Yen” carry trade is starting to turn the ECB's monetary policy upside down. The Euro's recovery from 151-yen on March 5th to a record high of 160-yen on April 10th, enabled gold to rebound from a low of 480 euros /oz to 506 euros /oz. European traders can borrow yen at roughly 1% and buy gold, while pocketing the Euro's gains against the yen. At the same time, Germany's 10-year bund yield briefly rose to a 3-½ year high of 4.15%, reflecting higher gold prices.
The Euro's strong recovery to a record high of 160-yen is linked to ideas that the European Central Bank will hike its repo lending rate by 50 basis points in the months ahead, and won't be matched by the Bank of Japan. Thus, in a strange twist of logic, signals of a tighter ECB money policy are actually elevating European gold prices, because of the distorting impact of the “Euro /yen” carry trade.
Gold would be about 3% higher if the ECB hadn't stepped up its sales in March, by dumping 45.5 tons into the gold market. Yet gold still managed to climb against the Euro last month, despite the ECB's stepped up sales. In Sept 2006, when the ECB dumped 50 tons of gold in the spot market and sold 100 tons in the forward market, gold plummeted by 40 euros to 440 euros /oz. In May 2006, when the ECB dumped 75 tons, gold plunged 120 euros /oz to 430 euros.
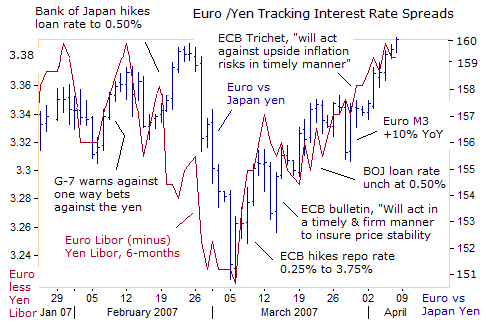
What's fascinating about the Euro /yen exchange rate these days, is that tiny moves in interest rate differentials between Europe and Japan are leading to explosive moves in the cross rate. The Euro's recovery from 151-yen to as high as 160-yen today, was accompanied by a mere 16 basis point increase in the Euro Libor rate over the Yen Libor rate. If the ECB has to lift its repo rate by at least 50 basis points to control the M3 money supply, without a similar increase by the Bank of Japan, the Euro /yen rate could soar, and in a strange twist, lift gold prices and German bund yields much higher, just the opposite of what the ECB would like to accomplish.
Shanghai Bubble Expands to Record Proportions
Jesse Livermore would have been intrigued by the Shanghai red chip market, which is reminiscent of the middle stages of the Nasdaq 1998-99 bubble. Left unchecked, the world is witnessing one of the greatest stock market rallies in history, ranked alongside Japan's Nikkei-225 of 1986-90 and the Russian Trading System Index. The Shanghai Composite Index closed at 3,444-points, a record high, and has gained 25% since its widely reported 9% dive on February 27th.
All lip service and tightening measures by Chinese authorities to keep Shanghai red chips from surging higher haven't turned back the Asian stampede. It's highly doubtful that Livermore, who made $100 million during the 1929 stock market crash, would try to pick a top or start short selling this market. Foreign money is flooding into China, with its trade surplus doubling to $46.4 billion in the first quarter.
On April 6th, the Chinese central bank hiked bank reserve ratios by 0.5% to 10.5%, ordering lenders to set aside more money in reserve for the sixth time in less than a year, removing about 170 billion yuan from the banking system.
But unless the required reserve ratio is raised to more than 13%, which isn't likely, the PBoC's efforts to slow explosive loan growth and the money supply are just cosmetic overtures. China's banks still have an average excess reserve deposit ratio of 3%, and its largest banks have the highest capital ratios, providing them with a sizeable cushion when they're ordered to increase reserves.
M2, China's broadest measure of money supply expanded at an annual 17.8% clip in February, and outstanding bank loans climbed 17.2 percent. New lending was 981 billion yuan for the first two months combined, almost a third of the total for all of 2006. Factory output in January and February combined grew 18.5%from a year earlier, blowing past the 16.2% rise logged in the first two months of 2006.
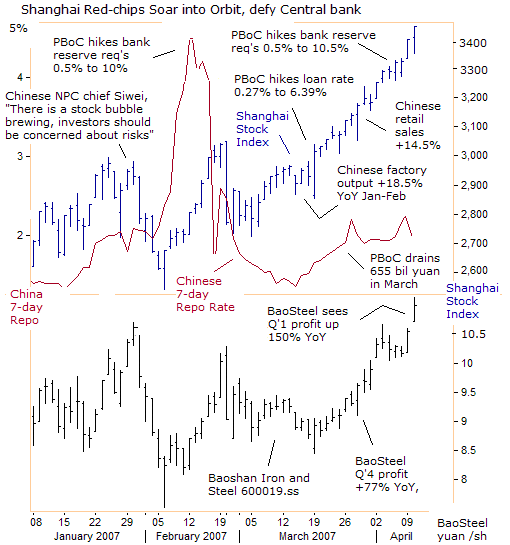
The PBoC drained 655 billion yuan from the banking system in March with T-bill sales, and guided the widely watched 7-day repo rate from as low as 1.5% in mid-March to 2% today. The Chinese central bank can issue one-year yuan T-bills at 3% in Shanghai to soak-up excess cash and deposit the funds in US 1-year bills at 5.25%. Thus, the PBoC has become the world's largest “yuan carry” trader.
But the 7-day repo rate remains far below the 2.7% consumer price inflation rate, indicating that China is still pursuing a super-easy money policy. Beijing has only allowed the yuan to appreciate by 1% so far this year, by printing enormous amounts of yuan to keep its currency artificially low.
Seeking to stay ahead of monetary inflation, Chinese investors are bidding up red-chips, and turnover in Shanghai A shares ballooned to a record 152.3 billion yuan ($19.7 billion) on April 10th. Baoshan Iron and Steel 600019.SS, China's top steel maker, said it expects to post a 150% jump in 2007 first-quarter net profit from a year earlier, boosted by higher steel prices. BaoSteel plans to raise its steel prices by 5% to 7% in the second quarter.
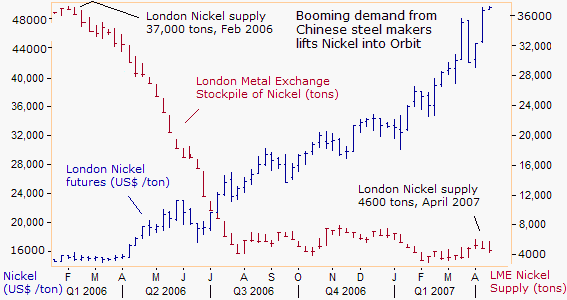
Strong demand from Chinese steel mills, the largest consumers of nickel, and tight supply have lifted nickel prices into the stratosphere, hitting a new record high of $50,000 per ton, up from $15,000 /ton a year ago. China produced 23.1% more crude steel in the first two months, or 74.25 million tons, after output grew 19.7% in 2006 to 422.7 million tons. China steel mills will become increasingly dependent on imports of lower-cost iron ore, which could rise by 60 million tons this year.
Livermore used to say there is nothing new under the sun in the stock market. But the “yen carry” trade is turning some long held fundamental beliefs about investing upside down. The Shanghai bubble has been seen before in different clothing, and it's possible that it might never come back down to earth, much like the Brazilian and Russian stock markets. But to keep in touch with the latest news and analysis of these markets and more, subscribe to the Global Money Trends newsletter.
By Gary Dorsch, Editor, Global Money Trends newsletter
http://www.sirchartsalot.com/newsletters.php
Copyright © 2005-2007 SirChartsAlot, Inc. All rights reserved.
Global Money Trends is now published weekly on Friday mornings ( 44 issues per year ). Here's what you will receive with a subscription,
Insightful analysis and predictions for the (1) top dozen stock markets around the world, Exchange Traded Funds, and US home-builder indexes (2) Commodities such as crude oil, copper, gold, silver, the DJ Commodity Index, and gold mining and oil company indexes (3) Foreign currencies such as, the Australian dollar, British pound, Euro, Japanese yen, and Canadian dollar (4) Libor interest rates, global bond markets and central bank monetary policies, (5) Central banker "Jawboning" and Intervention techniques that move markets.
GMT filters important news and information into (1) bullet-point, easy to understand analysis, (2) featuring "Inter-Market Technical Analysis" that visually displays the dynamic inter-relationships between foreign currencies, commodities, interest rates and the stock markets from a dozen key countries around the world. Also included are (3) charts of key economic statistics of foreign countries that move markets.
A subscription to Global Money Trends is offered at a special price of only $135 per year for “44 weekly issues”, including access to all back issues. Click on the following hyperlink, to order now,http://www.sirchartsalot.com/newsletters.php Call toll free from USA to order, Sunday thru Thursday, 2 am to 4 pm EST, at 866-576-7872.
© 2005-2022 http://www.MarketOracle.co.uk - The Market Oracle is a FREE Daily Financial Markets Analysis & Forecasting online publication.


