


Gold Long-term Bearish Projection Targets $480
Commodities / Gold & Silver Nov 16, 2008 - 06:52 PM GMTBy: Merv_Burak

 Gold went sideways while silver went lower. But the story of the week was the action in the stocks. The highest “quality” stocks moved lower by about 7% while the average stock declined by over 11%. Silver stocks did even worse with average declines over the 14% neighborhood. Are we ready for a bottom or is this just a continuation of the bear?
GOLD : LONG TERM
As far as the long term P&F chart is concerned, we are still heading towards that $480 projection with $630 along the way. Nothing new has developed in the P&F analysis since my comments last week.
As for the normal charts and indicators, well the Index continues below its negative sloping moving average line and the momentum indicator continues in its negative zone. The volume indicator is also below its long term trigger line. All three, gold, momentum and volume seem to be moving in more of a lateral direction and not in any serious downside one. This could change but at this time lateral seems to be the direction of least resistance. From the indicators, however, I must rate the long term as continuing BEARISH .
INTERMEDIATE TERM
There's been little change in the intermediate term prognosis since last week. Gold remains below its negative moving average line and the momentum indicator continues in its negative zone. The volume indicator is basically moving sideways but is below its negative trigger line. The action this past week has not generated any change in the rating, it remains BEARISH on the intermediate term.
SHORT TERM
Gold has been going through some pretty volatile daily gyrations over the past month but in the end going nowhere. It has been in a basic short term lateral trend which may continue until either the resistance or support is broken. That would be at about the $780 or $700 levels. If one wanted to be hopeful as to an upside break, the short term momentum indicator has been drifting upwards throughout these past few weeks as the price of gold went nowhere. However, to put a bummer into that positive, during lateral periods it is not unusual for the momentum indicator to be heading towards its neutral line during lateral price periods. This is neither positive nor negative, just the way it is. But let's get to the indicators. Gold closed on Friday above its short term moving average line and the line turned to the up slope. The short term momentum indicator remains just inside its negative zone but above its positive sloping trigger line. The daily volume seems to be perking up a little and on Thursday it was above its 15 day average volume level. Despite the still negative momentum position the rest of the indicators allow me to rate the short term as BULLISH .
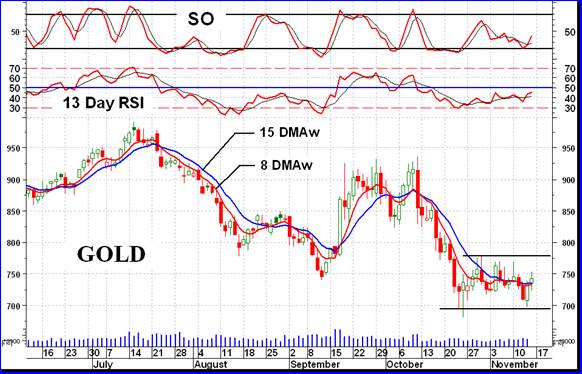
As for the immediate direction of least resistance, with the Stochastic Oscillator bouncing off its oversold line and the past two days being up days I guess that direction would be to the up side.
SILVER
Although silver and silver stocks may have had a worse week than gold all is not lost. Looking at a chart of silver and some indicators, there are some signs that behind the price action might be some underlying strength not easily visible. The volume indicator, although not all that great, is showing a slight positive trend over the past couple of months as silver price declined. The momentum indicator is in a lateral trend comfortably above its Sept low while silver price is somewhat below its Sept low. The intermediate term moving average line, although still heading downward, is at a level that should silver rally and close above its high of two weeks ago the price would then breach the moving average line to the up side and cause the line to turn upwards. All this is just minor warnings that all is not lost here BUT they are not yet indicators of a real reversal. We will have to wait for subsequent action to validate these warnings.
PRECIOUS METAL STOCKS
Although it was not a good week for the precious metal stocks we had a clear demarcation between the actions of the highest “quality” stocks versus the whole group. The quality stocks lost, on the average, 7.0% of their value. The rest of the precious metal stocks lost significantly more. Overall, my universe of 160 stocks lost an average of 11.0% while the silver stocks were greater losers with losses of around 15% (including the quality silver). There are times when speculators just throw up their hands and dump stocks. The speculative stocks are the ones to dump. The quality stocks are held mostly by institutions who do not dump their stocks but usually hold on through thick and thin. So, we have the speculative stocks dumped and the quality not so dumped.
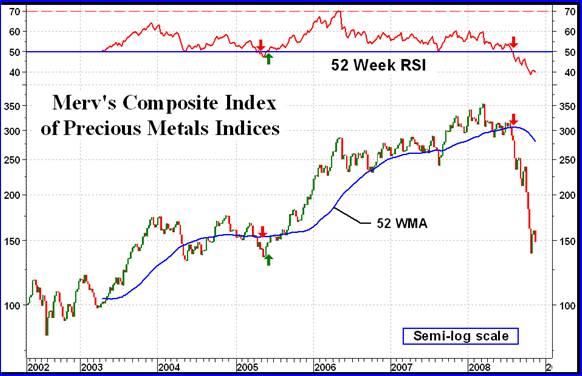
Over the past few weeks I have been showing charts of the various precious metal Indices that I have developed. Today's Index has been shown in the past. It is an Index of the average weekly performance of all of the components in my Precious Metals Indices Table shown below. The Index is moderated by the fact that it does include the actions of the U.S. Dollar Index which usually trends counter to the precious metals. It is also somewhat moderated by the inclusion of the gold and silver commodity futures prices. They are more likely to move at a much slower rate than the various stock Indices will so have a moderating effect. Having said all that, the chart is a very long term chart and only dates back to 2002 when it was first developed. The indicators are a 52 week RSI and a 52 week simple moving average.
Over the past couple of years one can easily see the warning that the 52 Week RSI has been giving by its under performance versus the performance of the Index. There was a clear warning by a negative divergence at the early 2008 Index top. Both the momentum and moving average slope went negative on 01 Aug 2008 and the plunge followed. Whether one believes in the charts and indicators or not one would be foolish not to take these warnings seriously. The risks are just too high.
Now we are waiting for the reverse to happen, a long term move by the momentum indicator above its neutral line and the slope of the moving average line to turn upward. That is still a long way away.
Merv's Precious Metals Indices Table
Let's call it another week.
By Merv Burak, CMT
Hudson Aero/Systems Inc.
Technical Information Group
for Merv's Precious Metals Central
For DAILY Uranium stock commentary and WEEKLY Uranium market update check out my new Technically Uranium with Merv blog at http://techuranium.blogspot.com .
During the day Merv practices his engineering profession as a Consulting Aerospace Engineer. Once the sun goes down and night descends upon the earth Merv dons his other hat as a Chartered Market Technician ( CMT ) and tries to decipher what's going on in the securities markets. As an underground surveyor in the gold mines of Canada 's Northwest Territories in his youth, Merv has a soft spot for the gold industry and has developed several Gold Indices reflecting different aspects of the industry. As a basically lazy individual Merv's driving focus is to KEEP IT SIMPLE .
To find out more about Merv's various Gold Indices and component stocks, please visit http://preciousmetalscentral.com . There you will find samples of the Indices and their component stocks plus other publications of interest to gold investors.
Before you invest, Always check your market timing with a Qualified Professional Market Technician
Merv Burak Archive |
© 2005-2022 http://www.MarketOracle.co.uk - The Market Oracle is a FREE Daily Financial Markets Analysis & Forecasting online publication.