US Dollar Bull Run, Gold, XOI, HUI, CBOE Put/Call Ratio
Commodities / Gold & Silver Nov 16, 2008 - 11:51 AM GMTBy: David_Petch

 I thought it would be better to present a market roundup rather than just the XOI, given the speed with which the market has moved the past few days. Yesterday saw a dramatic move off the lows, which by my judgement is half way through in the mere span of 3 hours. The S&P is likely to go anywhere from 1000-1050 and since the commodity indices (particularly the XOI) have a similar pattern, all should be watched together for indications of a top. The most critical element for all markets is the inverse relationship they have relative to the US Dollar at present. Today, the USD, XOI, HUI and CBOE Equity Put Call Ratio Index are discussed.
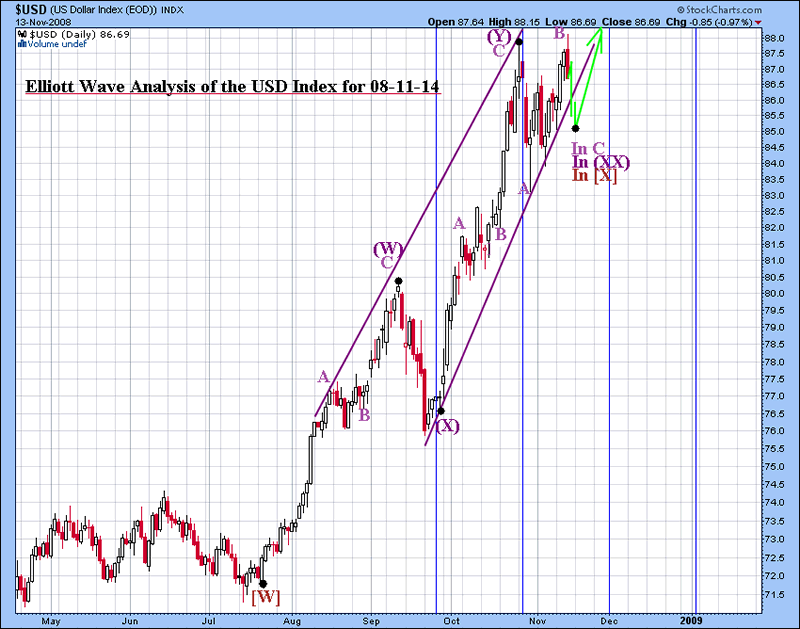
The mid-term Elliott Wave chart of the USD index is shown below, with a slight modification to the count. I have decided to go with a labeling scheme of the USD as a triple combination, with the present sideways action morphing into a flat instead of a triangle as indicated mid-week. Once this flat structure is over, expect the USD to continue higher with a final target of 95-100…I give some leeway based upon the uncertainty for how the final leg up develops. Everything is trading inverse to the dollar so when the USD tops out, there should be a good bounce in the broad markets…but note there still is a significant down leg quickly approaching before this is possible. The danger with a rising USD is that commodities are going to get squeezed harder, so any chance of a rally in commodities will most likely occur only once the advance in the USD has topped out.
Figure 1

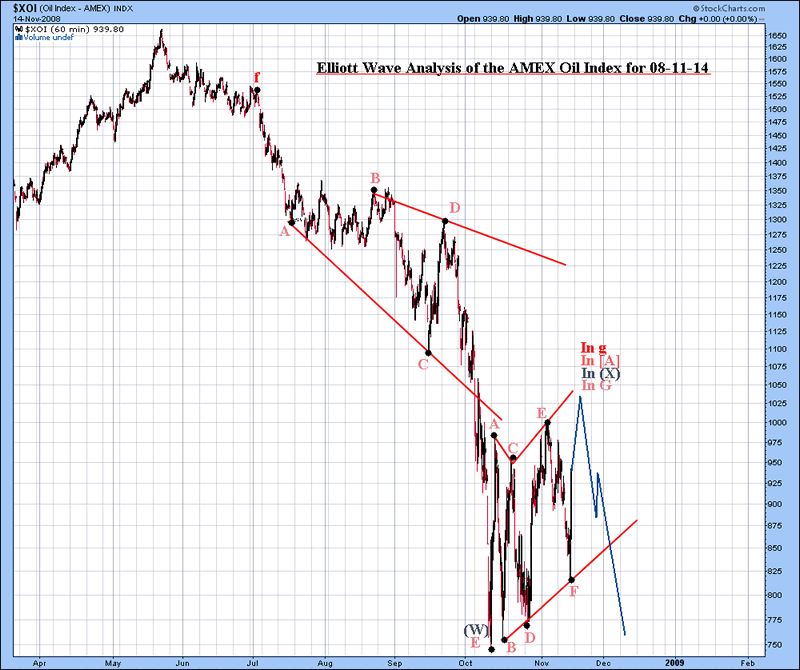
The XOI is shown below, with the thought pattern forming shown in blue. The decline for the XOI was a regular expanding triangle, whereas the S&P was an expanding triangle with reverse alternation. A diametric pattern is developing for the subsequent portion of the pattern, with the present leg nearly “half way done” based upon the expected target of 1000-1025. The XOI is likely going to decline to around 500-550 before bottoming and this should occur no later than the end of March 2009.
Figure 2

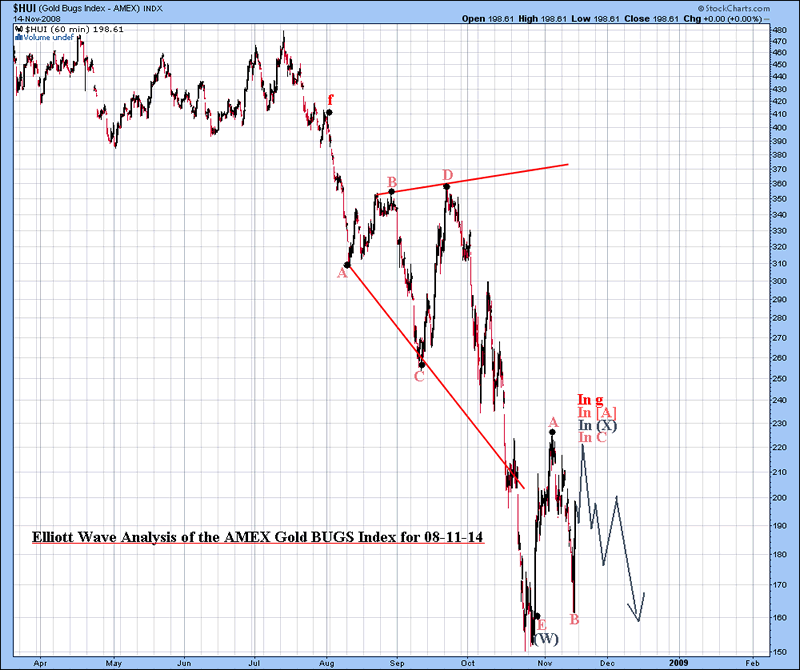
The Elliott Wave chart of the HUI is shown below, with the thought pattern forming shown in blue. The HUI also put in an expanding triangle, but there is no diametric…instead the developing structure is most likely a triangle or a flat. The HUI should bottom around 120 alongside the XOI, S&P etc. The severity of the decline in the coming months is going to be very sharp and lows in all indices could be in place before the end of February 2009.
Figure 3

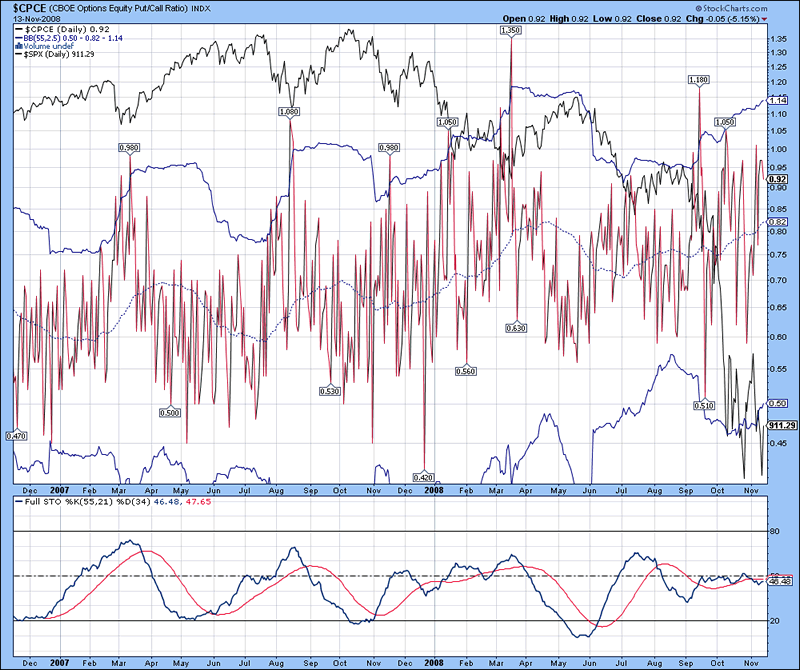
The CBOE Equity Put/Call Ratio Index is shown below, with the S&P 500 Index is shown in the background in black, with accompanying full stochastics shown below. For this chart, the %K above the %D indicates stock market weakness while beneath the %D indicates market strength. The %K is rising to cross above the %D within the zone of a pennant (contraction of the %K and %D since July 2008), suggestive that the upside move is nearing completion, followed by sharp decline after pattern completion.
Figure 4

By David Petch
http://www.treasurechests.info
I generally try to write at least one editorial per week, although typically not as long as this one. At www.treasurechests.info , once per week (with updates if required), I track the Amex Gold BUGS Index, AMEX Oil Index, US Dollar Index, 10 Year US Treasury Index and the S&P 500 Index using various forms of technical analysis, including Elliott Wave. Captain Hook the site proprietor writes 2-3 articles per week on the “big picture” by tying in recent market action with numerous index ratios, money supply, COT positions etc. We also cover some 60 plus stocks in the precious metals, energy and base metals categories (with a focus on stocks around our provinces).
With the above being just one example of how we go about identifying value for investors, if this is the kind of analysis you are looking for we invite you to visit our site and discover more about how our service can further aid in achieving your financial goals. In this regard, whether it's top down macro-analysis designed to assist in opinion shaping and investment policy, or analysis on specific opportunities in the precious metals and energy sectors believed to possess exceptional value, like mindedly at Treasure Chests we in turn strive to provide the best value possible. So again, pay us a visit and discover why a small investment on your part could pay you handsome rewards in the not too distant future.
And of course if you have any questions, comments, or criticisms regarding the above, please feel free to drop us a line . We very much enjoy hearing from you on these items.
Disclaimer: The above is a matter of opinion and is not intended as investment advice. Information and analysis above are derived from sources and utilizing methods believed reliable, but we cannot accept responsibility for any trading losses you may incur as a result of this analysis. Comments within the text should not be construed as specific recommendations to buy or sell securities. Individuals should consult with their broker and personal financial advisors before engaging in any trading activities as we are not registered brokers or advisors. Certain statements included herein may constitute "forward-looking statements" with the meaning of certain securities legislative measures. Such forward-looking statements involve known and unknown risks, uncertainties and other factors that may cause the actual results, performance or achievements of the above mentioned companies, and / or industry results, to be materially different from any future results, performance or achievements expressed or implied by such forward-looking statements. Do your own due diligence.
Copyright © 2008 treasurechests.info Inc. All rights reserved.
Unless otherwise indicated, all materials on these pages are copyrighted by treasurechests.info Inc. No part of these pages, either text or image may be used for any purpose other than personal use. Therefore, reproduction, modification, storage in a retrieval system or retransmission, in any form or by any means, electronic, mechanical or otherwise, for reasons other than personal use, is strictly prohibited without prior written permission.
David Petch Archive |
© 2005-2022 http://www.MarketOracle.co.uk - The Market Oracle is a FREE Daily Financial Markets Analysis & Forecasting online publication.


