


Stock Market Rally Against the Primary Trend
Stock-Markets / Stocks Bear Market Nov 14, 2008 - 09:33 AM GMT

 What a wild day on stock markets yesterday! At one stage the Dow Jones Industrial Average plunged to below 8,000, but staged a spectacular rally late in the session to close 553 points (6.6%) up on the day. The S&P 500 Index moved in tandem to finish the day 59 points (6.9%) higher.
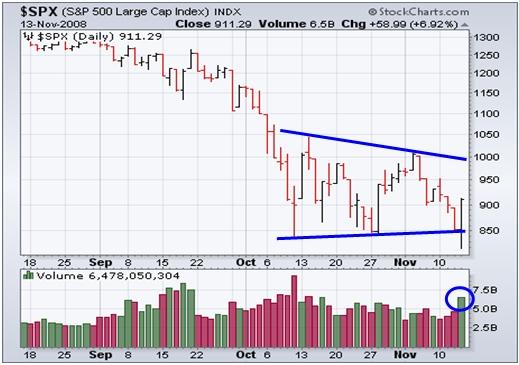
I referred to the characteristics of the so-called descending triangle on the S&P 500 in a post of two days ago (“ Stock Markets: Which Way Jos é ? ”), mentioning that a reversal to the upside often leads to a strong countertrend rally. A move in that direction occurred yesterday on the highest volume in a month. Although one shouldn't get too fired up about a one-day turnaround, the price and volume action was quite impressive, with the October 27 lows (8,176 on the Dow and 849 on the S&P 500) still intact.
The following daily graph summarizes the market action:
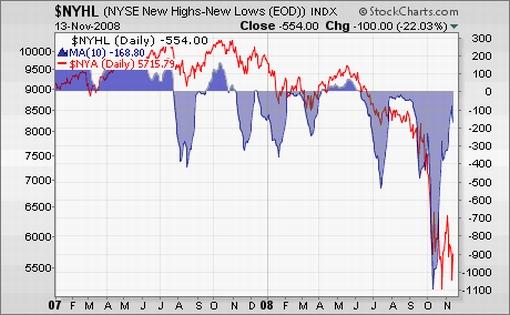
Importantly, the intraday lows of October 10, when the NYSE (red line in the graph below) made an “internal low” with 92.7% of stocks hitting new lows (blue area), have also not yet been violated.
A further positive for the bulls is that, according to Jeffrey Hirsch ( Stock Trader's Almanac ), the Dow has been up 12 out of the last 14 years during the week before Thanksgiving.
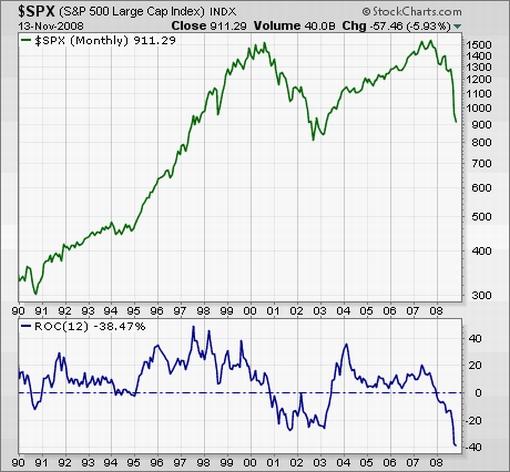
With the likelihood of further short-term gains a possibility (especially if the major indices record upside reversals on the weekly data by the end of today), it remains too early to tell whether a secular low has been recorded. The chart below shows the long-term trend of the S&P 500 Index (green line) together with a simple 12-month rate of change (or momentum ) indicator (blue line). Although monthly indicators are of little help when it comes to market timing, they do come in handy for defining the primary trend. An ROC line below zero depicts bear trends as experienced in 1991, 1994, 2000 to 2003, and again since December 2007.
Stock markets are caught between the actions of central banks, governments and the IMF frantically fending off a total economic meltdown on the one hand, and a worsening economic and corporate picture on the other. This situation has a “no-man's-land” feel to it. By all means try to play a possible nascent rally, but be cognizant that, failing further technical and fundamental evidence, you are trading against the primary trend. Caution is still warranted!
Did you enjoy this post? If so, click here to subscribe to updates to Investment Postcards from Cape Town by e-mail.
By Dr Prieur du Plessis
Dr Prieur du Plessis is an investment professional with 25 years' experience in investment research and portfolio management.
More than 1200 of his articles on investment-related topics have been published in various regular newspaper, journal and Internet columns (including his blog, Investment Postcards from Cape Town : www.investmentpostcards.com ). He has also published a book, Financial Basics: Investment.
Prieur is chairman and principal shareholder of South African-based Plexus Asset Management , which he founded in 1995. The group conducts investment management, investment consulting, private equity and real estate activities in South Africa and other African countries.
Plexus is the South African partner of John Mauldin , Dallas-based author of the popular Thoughts from the Frontline newsletter, and also has an exclusive licensing agreement with California-based Research Affiliates for managing and distributing its enhanced Fundamental Index™ methodology in the Pan-African area.
Prieur is 53 years old and live with his wife, television producer and presenter Isabel Verwey, and two children in Cape Town , South Africa . His leisure activities include long-distance running, traveling, reading and motor-cycling.
Copyright © 2008 by Prieur du Plessis - All rights reserved.
Disclaimer: The above is a matter of opinion and is not intended as investment advice. Information and analysis above are derived from sources and utilizing methods believed reliable, but we cannot accept responsibility for any trading losses you may incur as a result of this analysis. Do your own due diligence.
Prieur du Plessis Archive |
© 2005-2022 http://www.MarketOracle.co.uk - The Market Oracle is a FREE Daily Financial Markets Analysis & Forecasting online publication.