Stocks Bear Market Wedge Pattern Points to New Low -Yorba TV Show
Stock-Markets / Stocks Bear Market Nov 11, 2008 - 11:34 AM GMT

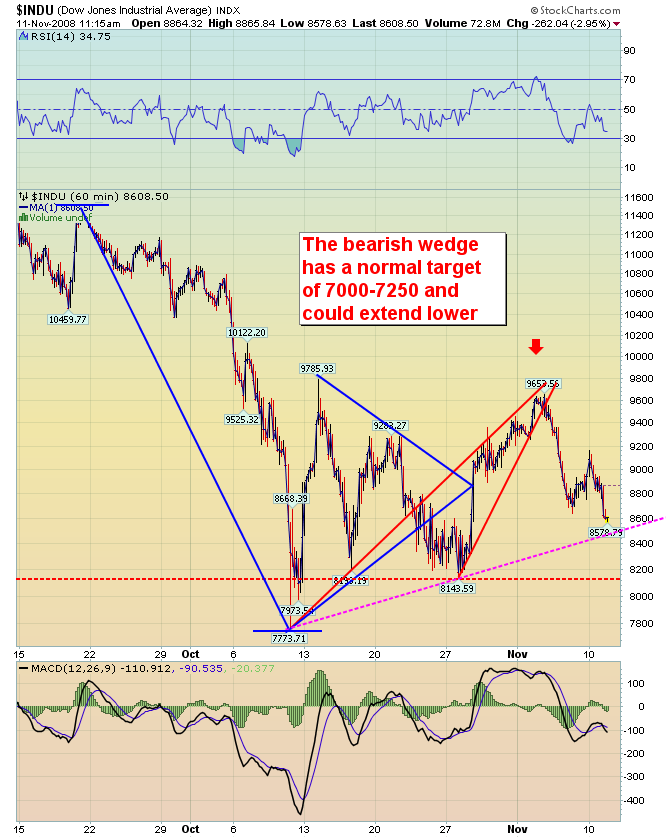
 It's time to think strategically about what is happening in the market today. There are so many theories and wave counts that it will make your head spin. However, let's see what the probabilities are based on the charts. A look at the Dow chart gives us a couple of immediate scenarios. Note the pink dotted line. This might be a potential support for the proposed triangle formation that some are advocating. This may already have been passed by the time the show is aired, so I will adjust my discussion accordingly.

The next item is the red dotted support line at 8143. A consolidation at this point without violating the October 27th low may have bullish implications, but also leaves the door open for a much larger decline to follow. Remember, the October low was 7773.71 on an intraday basis. This is only 370 points below critical support of 8143. A drop below that puts us within 600 points of the 2002 low of 7197. All of this could happen in a day or two. Folks, let's be aware that the next point of recognition might be that we may be going deeper than the 2002 low. The cycles and the waves both point that out as a distinct possibility.
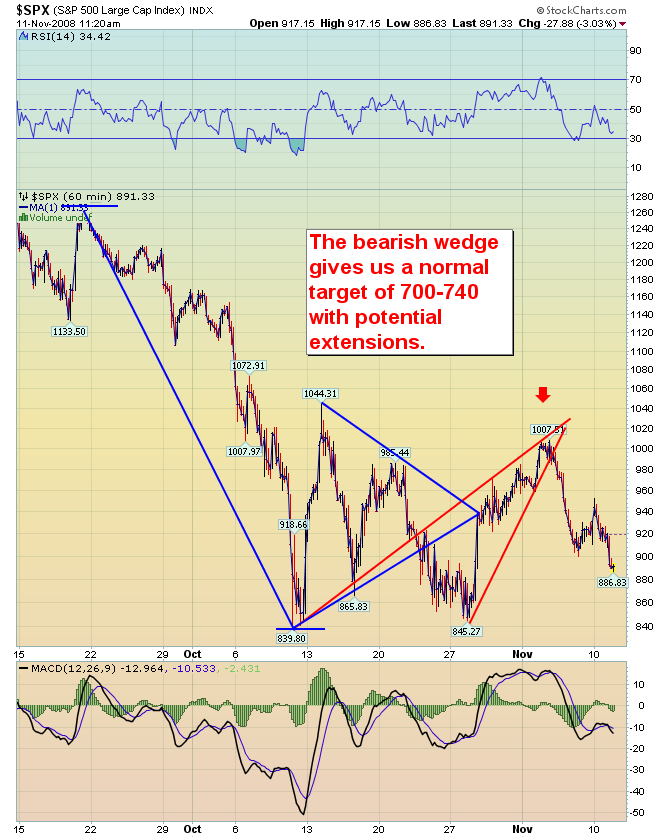
A look at the SPX chart pretty much rules out anything looking like a triangle. If support at 845 breaks, the October low is sure to follow. That leaves us immediately with the next target at 763, the October 2002 low. The question once we reach this point is, what part of the bull market from 1974 are we retracing?

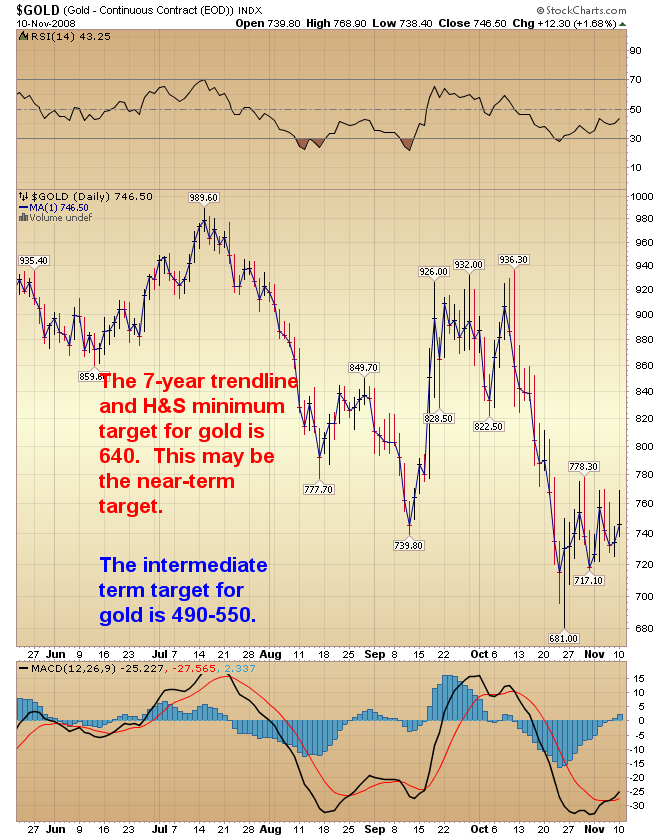
Finally, let's take a look at gold. Last month I suggested that 780 would be an important resistance for any rally in gold. It held and it appears that it is now breaking down. The December contract found support today at 725. Should it break through, there will be a much lower target for gold. Currently I am still looking at the head and shoulders target of 640, which corresponds with the trendline that has held gold up since June of 2001. Should it not hold, then my model suggests gold can go quite a bit lower, possibly between 500 and 550. I will keep you appraised of the targets as the decline gives me better definition.

This week's show on www.yorba.tv is packed with information about the direction of the markets. I'm on every Tuesday at 4:00 pm EDT . You can find the archives of my latest programs by clicking here .
Please make an appointment to discuss our investment strategies by calling Claire or Tony at (517) 699-1554, ext 10 or 11. Or e-mail us at tpi@thepracticalinvestor.com .
Anthony M. Cherniawski,
President and CIO
http://www.thepracticalinvestor.com
As a State Registered Investment Advisor, The Practical Investor (TPI) manages private client investment portfolios using a proprietary investment strategy created by Chief Investment Officer Tony Cherniawski. Throughout 2000-01, when many investors felt the pain of double digit market losses, TPI successfully navigated the choppy investment waters, creating a profit for our private investment clients. With a focus on preserving assets and capitalizing on opportunities, TPI clients benefited greatly from the TPI strategies, allowing them to stay on track with their life goals
Disclaimer: The content in this article is written for educational and informational purposes only. There is no offer or recommendation to buy or sell any security and no information contained here should be interpreted or construed as investment advice. Do you own due diligence as the information in this article is the opinion of Anthony M. Cherniawski and subject to change without notice.
Anthony M. Cherniawski Archive |
© 2005-2022 http://www.MarketOracle.co.uk - The Market Oracle is a FREE Daily Financial Markets Analysis & Forecasting online publication.


