Stock Markets Jammed Higher Before Final Capitulation
Commodities / Gold & Silver Stocks Nov 10, 2008 - 01:30 PM GMTBy: Captain_Hook

 This current batch of investors we have in the equity markets are for lack of a better term, incorrigible, meaning beyond hope, because just when it appeared a genuine capitulation to the downside was possible, stocks are being jammed higher overnight yet again. That being said, and never the less, we cannot fully discount the possibility this bounce will not be something ‘more substantial' however, which would be consistent with the notion we put forth over the past few days that equities bounce here only to fail in early November in a retest of present price levels. Unfortunately, without a panic blow-off to the downside this morning, such an outcome becomes more probable now from a sentiment related perspective, where for this reason we will need to follow open interest put / call ratios very closely in coming days.
The following is an excerpt from commentary that originally appeared at Treasure Chests for the benefit of subscribers on Tuesday, October 28th, 2008.
Of course if were just the dollar ($), and it's significantly overbought state, one would need to consider the lasting qualities of this morning's ‘jam job' in equities more seriously. With gold outperforming silver however, meaning credit related fears in the markets should be anticipated to return soon after the Fed decision tomorrow, possibly triggered by no rate cut, we know that any rally here in equities / precious metals will most likely fade without making too much progress, throwing us back into the situation that has been thwarting such efforts all along – investors need to capitulate for real – where the futures are limit down at the open, and they keep moving down to lower lows. That's when you will know we have a real possibility at a tradable bottom being in place. Until then your odds of picking a lasting bottom are likely as good at a craps table.
Again however, such considerations have never prevented the present investing population from doing the wrong thing to extreme, so who knows, given the stretched nature of technicals in the markets right now, perhaps they get their way for a period. Further to this, in reviewing a multitude of charts and ratios over the past few days, with precious metals the focus of today's study; the same conclusion was the result. We need a genuine capitulation to the downside in order to sponsor a lasting reversal, primarily evidenced in still falling stochastic indicators. I must say however, of all the indicators on the majority of pertinent charts it's only stochastic indicators that have this appearance however, with most oscillators already bottomed and / or showing positive divergences. So considering stochastics are lagging indicators, and appropriately defined oscillators can lead, we must take the possibility of a technical bounce at this time very seriously.
Let me show you what I mean in a chart review. Due to the number of charts involved commentary will be kept to a minimum.
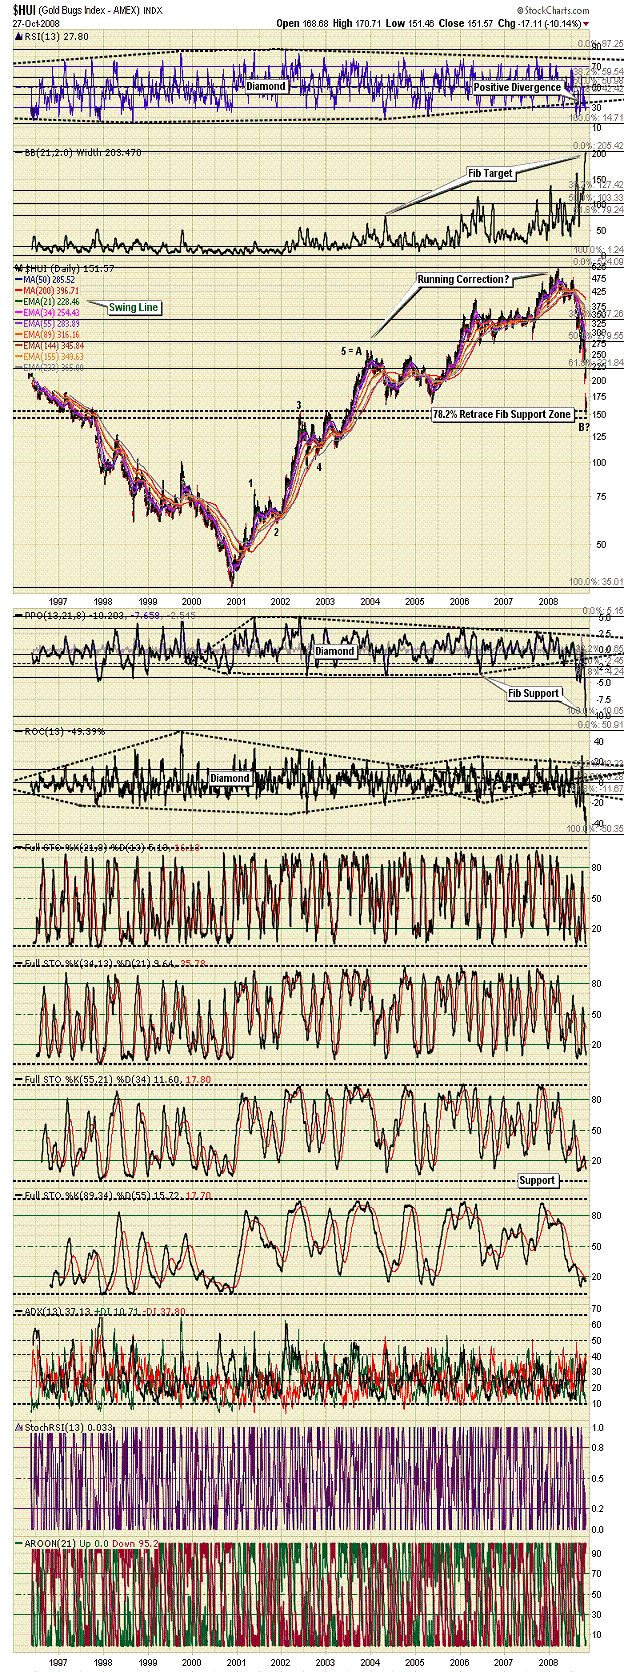
This first figure is the daily Amex Gold Bugs Index (HUI), where technicals are consistent with comments made above. Of course further to this, and discussed last week , the HUI is at the Fibonacci 78.2% retrace and structural support as well, highly suggestive some degree of a bottom is possible here. (See Figure 1)
Figure 1

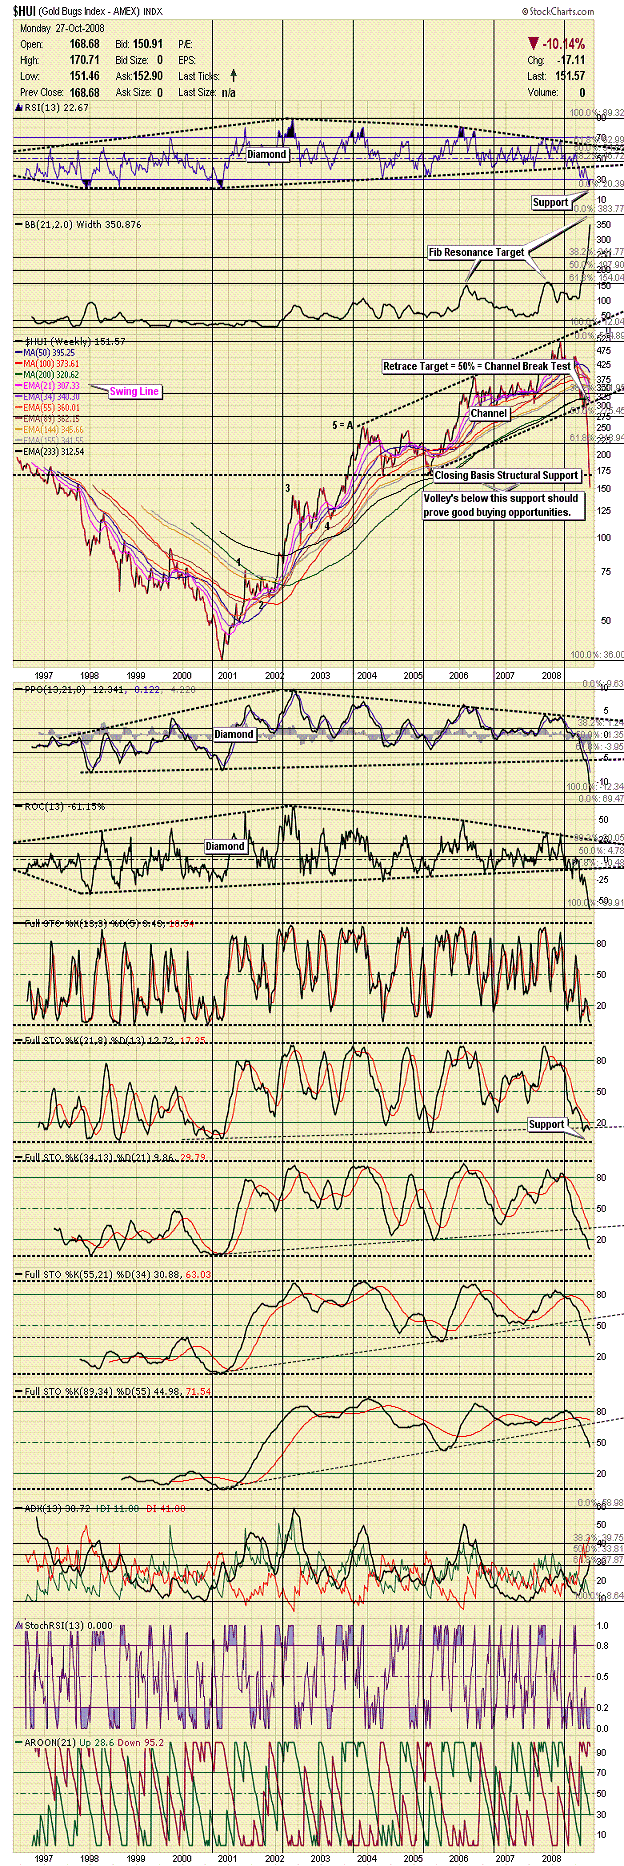
The second chart reviewed today is that of the HUI as well, but a closing basis weekly plot clearly showing the 165 area must be maintained at weeks end in order for the technical picture to remain positive on this basis. (See Figure 2)
Figure 2

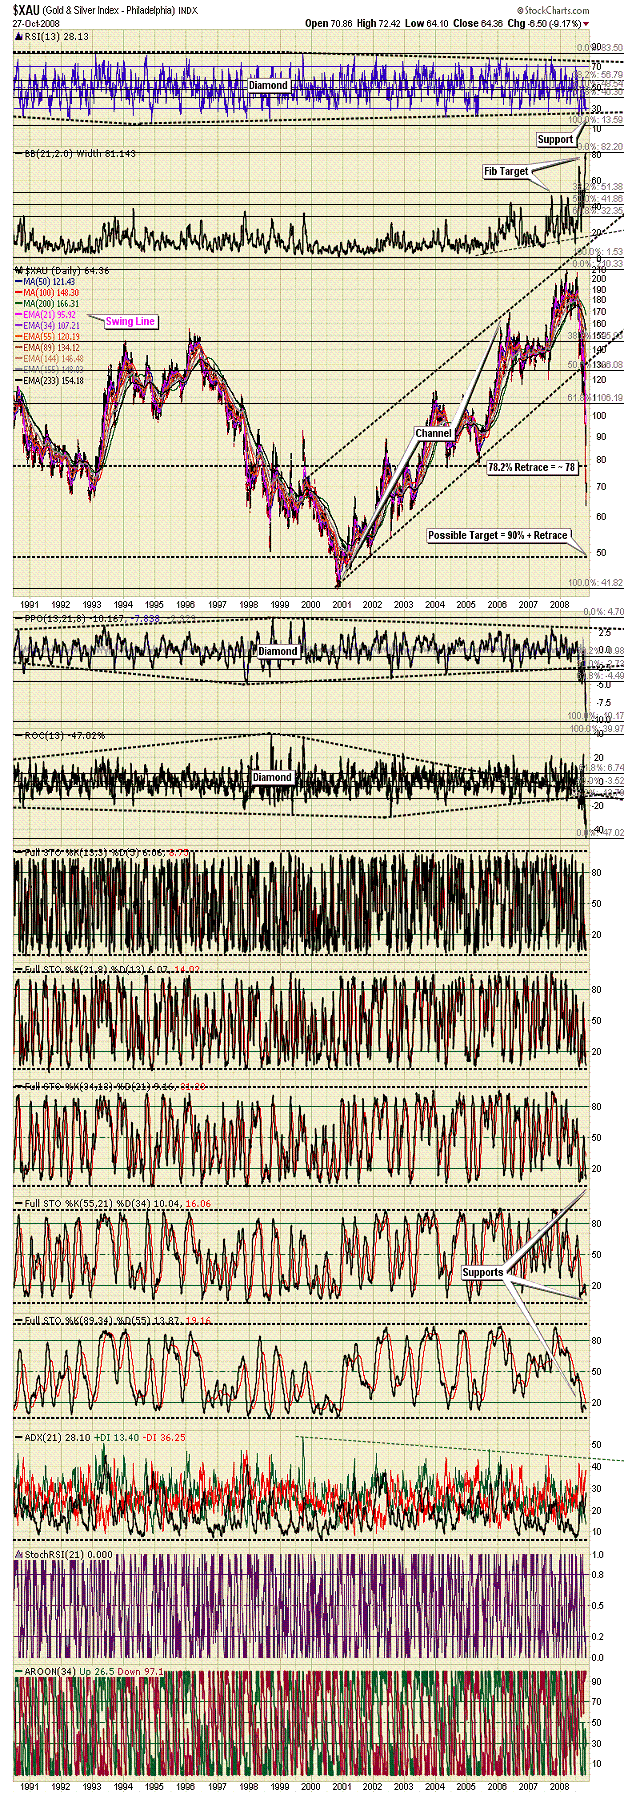
The next chart is the daily Philadelphia Gold And Silver Index (XAU), and like the HUI it shows while stochastics are pointing to further downside, where it's not inconceivable structural support at the large round number at 50 is vexed before this is all over, as suggested last week , at the same time technicals are getting stretched in this regard. (See Figure 3)
At least that's what one would think without looking at an appropriately configured monthly plot, seen here in this next figure, where surprisingly it appears considerably more downside is possible from a technical perspective. Thus, past what may prove to be just a bounce off technicals associated with dailies and weeklies, possibly testing the trend-line break at 105 indicated below, one must remain wary of negative possibilities within the intermediate-term associated with this picture. (See Figure 4)
Unfortunately we cannot carry on past this point, as the remainder of this analysis is reserved for our subscribers. Of course if the above is the kind of analysis you are looking for this is easily remedied by visiting our continually improved web site to discover more about how our service can help you in not only this regard, but also in achieving your financial goals. For your information, our newly reconstructed site includes such improvements as automated subscriptions, improvements to trend identifying / professionally annotated charts , to the more detailed quote pages exclusively designed for independent investors who like to stay on top of things. Here, in addition to improving our advisory service, our aim is to also provide a resource center, one where you have access to well presented ‘key' information concerning the markets we cover.
And if you have any questions, comments, or criticisms regarding the above, please feel free to drop us a line . We very much enjoy hearing from you on these matters.
Good investing all.
By Captain Hook
http://www.treasurechestsinfo.com/
Treasure Chests is a market timing service specializing in value-based position trading in the precious metals and equity markets with an orientation geared to identifying intermediate-term swing trading opportunities. Specific opportunities are identified utilizing a combination of fundamental, technical, and inter-market analysis. This style of investing has proven very successful for wealthy and sophisticated investors, as it reduces risk and enhances returns when the methodology is applied effectively. Those interested in discovering more about how the strategies described above can enhance your wealth should visit our web site at Treasure Chests
Disclaimer: The above is a matter of opinion and is not intended as investment advice. Information and analysis above are derived from sources and utilizing methods believed reliable, but we cannot accept responsibility for any trading losses you may incur as a result of this analysis. Comments within the text should not be construed as specific recommendations to buy or sell securities. Individuals should consult with their broker and personal financial advisors before engaging in any trading activities, as we are not registered brokers or advisors. Certain statements included herein may constitute "forward-looking statements" with the meaning of certain securities legislative measures. Such forward-looking statements involve known and unknown risks, uncertainties and other factors that may cause the actual results, performance or achievements of the above mentioned companies, and / or industry results, to be materially different from any future results, performance or achievements expressed or implied by such forward-looking statements. Do your own due diligence.
Copyright © 2008 treasurechests.info Inc. All rights reserved.
Unless otherwise indicated, all materials on these pages are copyrighted by treasurechests.info Inc. No part of these pages, either text or image may be used for any purpose other than personal use. Therefore, reproduction, modification, storage in a retrieval system or retransmission, in any form or by any means, electronic, mechanical or otherwise, for reasons other than personal use, is strictly prohibited without prior written permission.
Captain Hook Archive |
© 2005-2022 http://www.MarketOracle.co.uk - The Market Oracle is a FREE Daily Financial Markets Analysis & Forecasting online publication.


