Gloom and Doom Folks Will Soon be Proven Wrong
Stock-Markets / Stocks Bear Market Nov 10, 2008 - 06:13 AM GMTBy: Ronald_Rosen

 If you stand to close to a painting you may never see the entire picture. Seen from a distance, the Rembrandt "standing" self portrait in Vienna (1652) shows the bold, confident appearance that is usually attributed to it.
Click here… > Heavy Mellow.
It is the same with the markets that we follow. If one concentrates only on the very short term they will not see the larger picture. The larger picture, the very long term picture as epitomized by the charts posted below is informing us that once again, THE GLOOM AND DOOM FOLKS WILL SOON BE PROVEN WRONG.
 |
 |
The S & P 500 and the D. J. I. A. should bottom no later than March 2009. That is what Super Long Term Delta # 1 low is telling us. This means the bottom may have occurred in October 2008. However, if a lower low occurs the final bottom before a move up will arrive by March 2009. The next Super Long Term Delta turning point after SLTD # 1 low has arrived is SLTD # 2 high. Prices going back as far as 200 years show that there has never been an inversion of Super Delta Long Term # 1 or # 2. Therefore the probability of SLTD # 2 high inverting to a low is very slight. SLTD # 2 high is due no later than February 2010. At the very least this means that there will be a substantial rally in the stock indexes to begin no later than March 2009 and end no later than February 2010.
A much more bullish scenario would indicate that instead of a substantial rally we will have the beginning of a major bull market. If SLTD # 1 low marks the beginning of a major bull market in the stock indices it will be Major Wave Five of the long term bull market that began in 1920. This was 7 years after the Federal Reserve System was established. With all the extreme long term negativity in place throughout the world’s markets the probability that we may witness or be witnessing the beginning of long term bullish Major Wave Five in the stock indices should not be ignored. What will this mean to the precious metals complex? I explore the timing answer to that question further on in this report.
Looking at stock market charts going back about 200 years, almost every SLTD # 14 high was followed by a major down move. This was true in 1929, 1987 and the current decline that began in October 2007 at SLTD # 14 high. The new high in the S & P 500 that occurred in October 2007 was unconfirmed by a lower high in the MACD indicator. This was another indication that a severe decline was about to unfold. The overwhelming negativity expressed by so many market experts world wide is indicative of a market that has either bottomed or is in a bottoming process. All of the many popular books written about the end of our world as we have come to know it will once again be proven at best premature and at worst, well, I’ll let others decide that. The end of the very long term bull market that began with the advent of the Federal Reserve System will probably sneak up on this world unheralded by the doom and gloom crowd. However, if we keep our eyes on the big picture we won’t be unprepared when the time arrives. The time is not now as I read the markets.
This chart shows SLTD # 14 high having topped in October 2007.
SLTD # 1 low is shown as either having bottomed or bottoming before March 2009. The biggest moves tend to occur on either side of # 1.
S & P 500 QUARTERLY
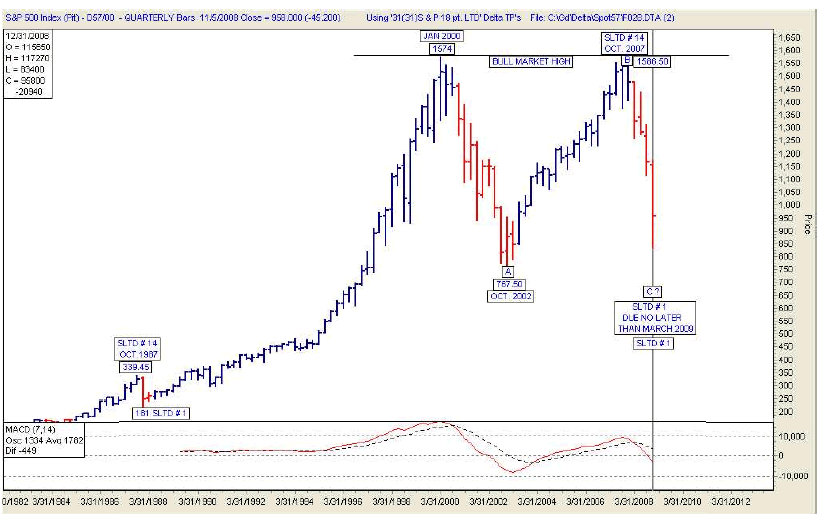
 The S & P 500 has nearly completed a perfect Flat type correction that began in the year 2000. Once complete this formation portends a substantial bull move beginning.
“A flat correction differs from a zigzag in that the subwave sequence is 3-3-5. Since the first wave, wave A, lacks sufficient downward force to unfold into a full five waves as it does in a zigzag, the B wave reaction seems to inherit this lack of countertrend pressure and terminates near the start of wave A. Wave C generally terminates just slightly beyond the end of wave A rather than significantly beyond as in zigzags.” E. W. P. Flat Correction
The last bear market in the D. J. I. A. bottomed in December 1974. The fifth wave up in the gold bull market broke out to a new high in Feb. 1978 and topped in Jan. 1980
GOLD BULLION 1920 to 2000


DOW JONES INDUSTRIAL AVERAGE
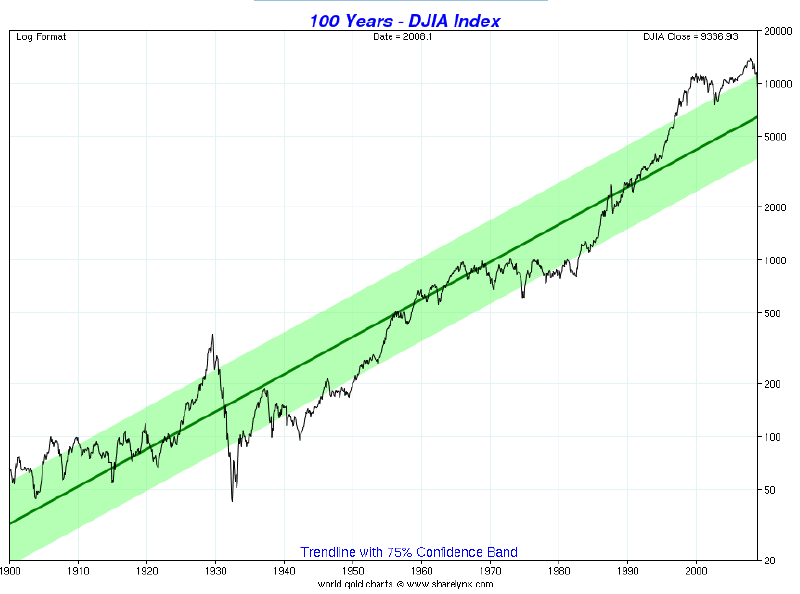
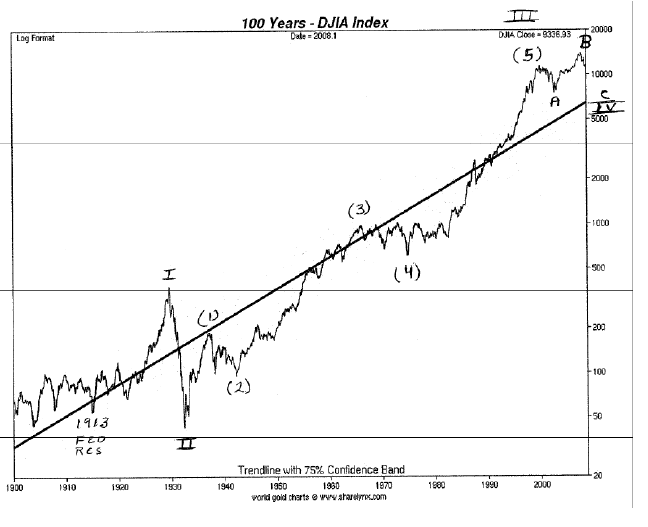
The very long term bull market picture that I am referring to began in 1920 shortly after the Federal Reserve System was created. We are currently living through the final C leg down of the A, B, C, bear market that began in the year 2000. The completion of this bear market will be the end of Major Wave IV. This will be followed by the final bull market Major Wave V. When the final Major Wave V is complete I expect that all of the imbalances that have built up since the creation of the Federal Reserve System will be corrected. Ah ha, if you want to know when that will occur and how long the corrective period may take, you must remain a long term subscriber! If I am with the Great Master in the Sky you can rest assured that my younger partner Alistair Gilbert is more than prepared and qualified to guide you through that most difficult period
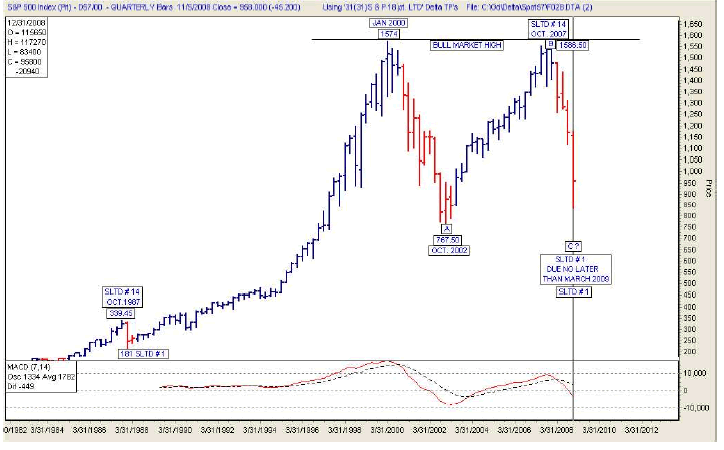
The chart of the S & P 500 is lined up with the gold chart. As the S & P 500 is bottoming the HUI and XAU gold share indices should be rising with the price of gold and silver. They should continue rising while the first wave of the bull market in the S & P 500 and the D. J. I. A. unfolds.
S & P 500
GOLD
SUMMARY
The 1966 to 1974 bear market in the D. J. I. A. and the S & P 500 bottomed in December 1974. Gold bullion kept on going up right through the first wave of the new bull market in the stock indices that began in December 1974.
The bull market in gold topped in January 1980.
The bull market in gold shares topped in October 1980.
The current bear market in the D. J. I. A. and the S & P 500 began in the year 2000. They have either bottomed in wave C of a flat A, B, C correction in October of this year or will likely bottom before March 2009.
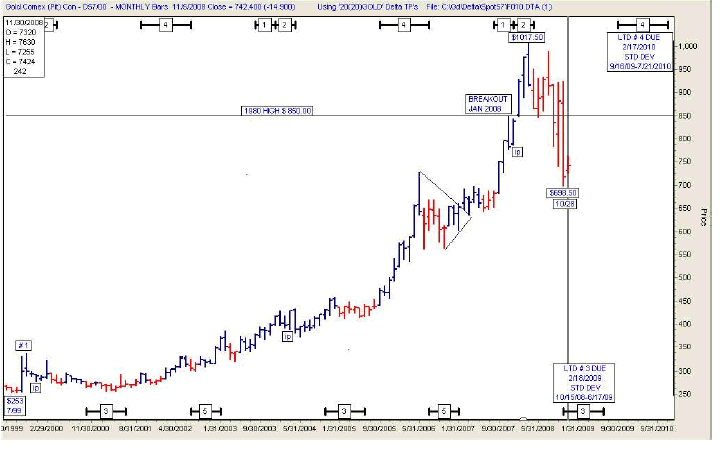
The current gold bullion correction may have bottomed in October of this year. The final Major Wave Five in gold may be on the way to new highs. The first indication will be a close over the $850 level. The $850 level was the previous high 28 years ago in 1980. The next confirmation will be a new all time high above $1017.50 which was the high of the most active nearest futures contract in March 2008.
The excesses that built up in the bull market and in the major stock averages that began in December 1974 and topped in the year 2000 should be completely removed by the time a bottom is reached by or before March 2009. The bull market that I am referring to lasted approximately 26 years. A bear market that eliminates the excesses in price, price earnings ratios (P.E.’s), and excess optimism would require about one third of the time consumed by the bull market.
The current bear market began in January 2000. (Remember Y2 K?) The bear market bottomed in October or will bottom no later than March 2009. That will mean that the bear market lasted nine (9) years. That should do it in spite of all the moaning and groaning and hair pulling and bleating about the end of our world as we knew it. The next bear market will be correcting all of the excesses that have built up since the Federal Reserve System was founded in 1913. If you can find a book that writes about the coming bull market in stocks and the period of prosperity ahead of us, buy it. I surely can not find one. So, save this report. If I’m still around when the next and final bull Fifth Wave ends I’m going to opt for a Viking Funeral. That’s the only way for a true Captain to go!
Subscriptions and the Delta Turning Points are available at: www.wilder-concepts.com/rosenletter.aspx Updates will be posted when market action warrants.
Stay well,
Ron Rosen and Alistair Gilbert
M I G H T Y I N S P I R I T


Ronald L. Rosen served in the U.S.Navy, with two combat tours Korean War. He later graduated from New York University and became a Registered Representative, stock and commodity broker with Carl M. Loeb, Rhodes & Co. and then Carter, Berlind and Weill. He retired to become private investor and is a director of the Delta Society International
Disclaimer: The contents of this letter represent the opinions of Ronald L. Rosen and Alistair Gilbert Nothing contained herein is intended as investment advice or recommendations for specific investment decisions, and you should not rely on it as such. Ronald L. Rosen and Alistair Gilbert are not registered investment advisors. Information and analysis above are derived from sources and using methods believed to be reliable, but Ronald L. Rosen and Alistair Gilbert cannot accept responsibility for any trading losses you may incur as a result of your reliance on this analysis and will not be held liable for the consequence of reliance upon any opinion or statement contained herein or any omission. Individuals should consult with their broker and personal financial advisors before engaging in any trading activities. Do your own due diligence regarding personal investment decisions.
Ronald Rosen Archive |
© 2005-2022 http://www.MarketOracle.co.uk - The Market Oracle is a FREE Daily Financial Markets Analysis & Forecasting online publication.


