The Impact of Deleveraging on Economic Growth
Economics / Credit Crisis 2008 Nov 08, 2008 - 10:50 AM GMTBy: John_Mauldin
 The Problems of Deleveraging
 - 1.2 Million Jobs and Counting
- Be Careful of Geeks Bearing Recovery Data
- Back to 1982
In general, we consider it a good thing to save money and to "owe no man anything save love." But what happens when a debt-happy society wakes up and decides that saving is a good thing for everybody? What happens when banks and hedge funds decide (or are forced) to reduce their debt? What happens when businesses of all sizes find it harder to get loans to operate?
In this week's letter we discuss "The Great Unwind," that process of deleveraging that we are now in the midst of. We also explore some recent economic data on the economy. It's a lot of ground to cover, so let's jump right in.
1.2 Million Jobs and Counting
The unemployment numbers came out today and they were ugly. October showed a loss of 240,000 jobs. But the really bad part was the negative revision to August and September, by a further loss of 179,000. As I have written in the letter numerous times, downward revisions in a slowing economy are the rule. Unemployment estimates are largely based on recent past performance. There is no way the models can catch a change in the overall trend. All the statisticians can do is go back and modify the data as hard information becomes available.
What the data shows is that the economy has lost 1.2 million jobs since December, with over half of those losses in the last three months as the problems from the recession accelerate. While two-thirds of the losses are in manufacturing and goods production, the service economy is also starting to show signs of strain. One in five lost jobs are from the retail sector.
 Philippa Dunne of The Liscio Report writes: "A stunning fact: yearly job losses in private services, 0.4%, now match the worst of the 1982 recession and exceed the worst of 1975; once upon a time, the service sector wasn't very cyclical. Now it is."
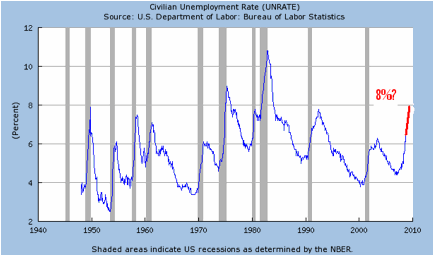
Just as disturbing is the jump in the unemployment rate. It leaped to 6.5%, far above even the most dismal of expectations. For reasons we will go into below, it is likely we will see another 1 million jobs lost over the next year, with the unemployment rate headed up as high as 8%. There are now ten million unemployed Americans. You have to go back to 1982 and a double-dip recession to find an 8% unemployment rate. Very few people under 50 remember what that is like.
Look at the chart below. Notice how swiftly unemployment rises during a recession and continues to rise even after the recession is over. Since I do not think the current recession will be over until the third quarter of next year, we could see unemployment continue to rise for the next 8-10 months. At least, I hope it doesn't last longer.
Be Careful of Geeks Bearing Recovery Data
Before we look at how weak the economic numbers were from both the manufacturing and service sector surveys, let me cover an important point about recessions. You are going to hear all sorts of analysts (including sometimes even this humble analyst!) quote statistics that in general sound like: "Since the end of WWII average recessions have lasted X months, and thus we are almost through the current one, so buy what I am selling." Or the ever popular "Stocks tend to find the bottom in the middle of a recession, so now is the time to buy."
There will be lots of variations that all assume that past performance is somehow indicative of future results. And such an assumption is a prescription for investment pain.
First, there are not enough data points about recessions between the end of WWII and now to have any statistical meaning. I count 11 recessions since WWII. In what other human endeavor would we use just 11 data points and then decide to bet our hard-earned money? While average data can have meaning and give some grounds for comparison, it should be treated with heavy levels of skepticism when used as an argument for investing with conviction.
Let me tell you what we do know. Each and every recession is different from all the others and in different ways. That stands to reason, as the background economic environment was different for each one. The '70s and '80s were subject to serious levels of inflation. The recession at the beginning of this decade saw fears of deflation. Some happen with a strong dollar and some with a weaker dollar.
This recession is the result of serious bubbles in the housing and credit markets imploding. It is not the result of excess inventory or overinvestment in manufacturing capacity. As I have written numerous times, these excesses took years to build up and will take at least 2.5-3 years to correct. We are 15 months into the correction process. That is unlike any other recession we have experienced. So be careful in your use of comparisons based on historical averages.
One more point: since we do not know how long this recession will last, nor do what the results will be from further stimulus packages and hidden surprises, it is a mug's game to try and pick a bottom in the stock market based on some theoretical halfway point of this recession. You are going to hear over and over that markets anticipate the recovery about six months in advance. Given that this may be a very long and slow recovery that could be quarters away, be very cautious when you hear some bullish commentator using that "anticipation" rhetoric.
And with that said, let me now turn and look at some comparisons with past recessions that do offer some insight. By looking at how severe this recession is compared to previous ones, we can glean some idea of the level of problems we face now.
Back to 1982
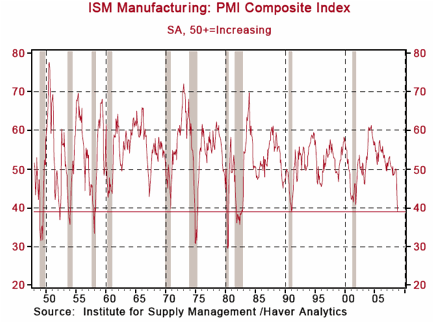
The Institute for Supply Management released their October survey this week, and it was a shocker, helping send the Dow down by 10% in two days. It showed much more weakness than expected. This survey is collected from a large number of manufacturing firms. The ISM then makes an index of the data. For instance, if 60% of the reporting companies see new orders rising, then that would yield an index number of 60 for new orders. Anything below 50 shows negative growth. Below 40 shows a serious recession
 The overall manufacturing number came in at a very weak 38.9. We are now down to levels not seen since September 1982. (Chart courtesy of Paul Kasriel and Northern Trust)
The internal data was even worse. New orders fells to 32, suggesting further weakness in the manufacturing world. Backlog of orders was 29. New export orders, a source of growth in recent months, fell from 52 to 41, a rather large drop for a single month. This shows the rest of the world is beginning to slow down as well. Boding poorly for employment, only 43% of companies reported that they were planning to add additional employees.
Nowhere was that illustrated more than in the auto sector. Last year sales were running at about 17 million new cars a year. Last month's annualized rate was 10.5 million, the lowest level since 1983. And a recovery might not be in sight for several years.
There is now about one car in the US for every person of driving age. An article in the Financial Times estimates that an extra 1.5 million cars a year have been purchased due to cheap financing, rebates, etc. If consumers decided they did not need more than one car, which would imply a flat growth rate, sales could drop by 3.5 million cars a year from the pre-crisis levels, which means Detroit would have a lot of spare capacity even after an economic recovery.
Further, I remember buying a car as a young man and not expecting it to last more than 80,000 miles before it needed major work or replacing. I now drive a 4-year-old Cadillac Escalade (I am a Texan, after all!) and it has 65,000 miles. I have a friend with an identical car that has 270,000 miles on it, and it is still running fine. My car could easily last me another four years, as could the cars of many people who bought new ones in recent years.
Basically, automobile manufacturers, in their drive to sell as much as possible, "brought forward" future sales of cars and, as a side effect, put lots of still quite good used cars on the road. New car sales are likely to be depressed for some time. It is somewhat like the housing problem. There is just too much inventory on the road that will have to be worked through. When Detroit gives me a real reason to buy another car, like an electric-powered vehicle, I will. And a lot of Americans, with a need to save money for retirement, are going to feel the same way.
As noted above, it seems that the service sector is now cyclical. The ISM Non-Manufacturing Survey results show broad-based weakness. The headline composite index dropped to 44.4 in October from 50.2 in September. This is the lowest in the 11-year history of this index. Indexes tracking new orders and employment also fell sharply, to 45 and 42 respectfully.
The data shows that we are sadly not yet close to the end of this recession. It is going to be a long slow Muddle Through Recovery. Do not expect a typical V-shaped recovery.
The Problems of Deleveraging
There is a quite humorous series of quote about the demise of the American consumer, starting with a Fed chairman in 1954 and going through one after another major financial figure in the ensuing decades. They have all been wrong. Predicting that the American consumer will change his profligate ways has not been a recipe for forecasting accuracy. This time, it may be different. Not because US consumers really wants to change, but that they may be forced to.
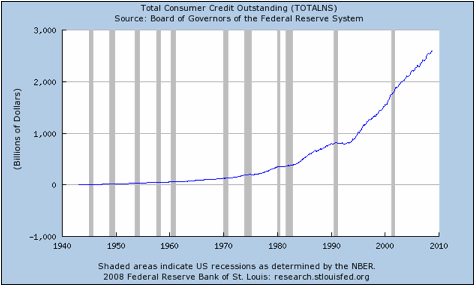
 Look at the explosion of consumer debt (credit cards, auto loans, bank loans) over the last 20 years, rising to $2.6 trillion. Household debt, including mortgages, skyrocketed from 47% of personal income in 1959 to 117% in the fourth quarter of 2007. And from 25% of GDP in the first quarter of 1952 to 98%. (Gary Shilling)
Let's look at some numbers. Since 1 January, 2008, owners of stocks of US corporations have suffered about $8 trillion in losses, as their holdings declined in value from $20 trillion to $12 trillion. (Losses in other countries have averaged about 40%.) Homeowners will soon see their equity down by as much as $8 trillion, and those losses are likely to increase.
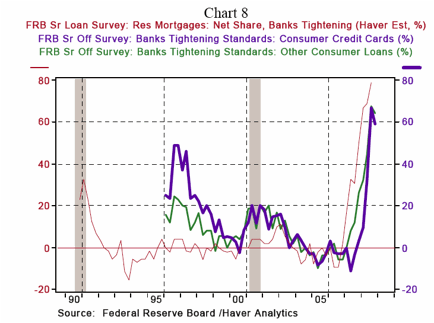
As highlighted here repeatedly, mortgage equity withdrawals counted for a full 3% of annual GDP growth in the period from 2002-2007. MEWs have fallen by 95%, and are falling again this quarter. Credit card debt is being reigned in. In fact, as the chart below shows, bankers are not surprisingly tightening lending standards to consumers, and raising their rates. (Again, from Haver Analytics, courtesy of Northern Trust)
Much of US GDP growth has been fueled by debt. And that debt is now going to be much harder to get, as equity in both houses and stocks has fallen precipitously.
 Further, as detailed last week, US consumers are clearly cutting back. The retail sales figures that came out this week are dismal. J.C. Penney stores are down 13% year over year! At Nordstrom's, one of my favorite stores, sales are down almost 16% (six months ago they were growing at 10%!). Sales at major discounter Costco were down 1%. The Gap, The Limited, Target - store after store is down. Limited Brand sales are down by 70% from October of last year. All this does not bode well for Christmas sales. (Thanks to Greg Weldon of www.weldononline.com for that data.)
Remember how I talked about how auto manufacturers had cannibalized future sales? Credit cards have allowed many retailers to do the same. Money that goes to cut down credit card debt is money not spent today.
Consumers leveraged their way to higher levels of consumption, and now are going to be forced to reduce that leverage. Many others are going to see the need to increase savings to shore up retirement funds. People (and not just in the US, but throughout Europe) have learned that a home is not an investment.
Hedge funds are also being forced to de-lever. While for most styles of hedge funds, leverage was not all that high (an average of about 1.4 times equity), large redemptions, especially by funds of funds, are forcing sales of all types of assets, but in particular stocks. As an aside, this selling is not over. Mutual funds are seeing large withdrawals, and are also selling.
Large banks are being forced to reduce credit lines in order to shore up capital, as they must deal with subprime debt and other mortgage-related problems. Smaller banks are just now starting to deal with losses on commercial loans due to the economic downturn. That means that they will have to reduce their loan portfolios to meet capital requirements.
This is happening all over the world. Whole countries are imploding. Iceland? What were they thinking? Italian sovereign debt is now suspect, calling into question their ability to meet their deficits.
Just as consumers used debt to buy "stuff" they wanted now, so did businesses, banks, and governments. It powered a huge global growth boom. The Great Unwind will have the opposite affect, softening demand and weakening spending and growth. What leveraging did for growth, deleveraging will take back. It is likely to be a long, Muddle Through trip.
The IMF now projects that the developed world will slow by a collective 1% next year, dragging world growth close to zero. The export growth that has been powered by a cheap US dollar is destined to slow as world demand falls.
The good news? Oil prices are likely to fall even more, which will free up some money to be used in other ways. The ISM data showed that prices paid are falling, making inflation less likely. The US government deficit, under Democratic control, is likely to be $2 trillion in 2009, a staggering number to be sure. Without the pressure of inflation, and with the threat of outright deflation, it may even be that such a deficit can be managed. In the short term, this massive debt will provide a stimulus, lessening the effects of a deep recession.
The sad thing is that our children will be saddled with the debt for a very long time. Hopefully we spend it on things like infrastructure, which will be of some use to them, rather than on an endless stream of consumer stimulus packages that simply add to current debt.
As investors, businesses, and employers/employees, we will have to deal with the outcome of a major resetting of consumer spending. Unemployment will rise. Whatever stimulus package is enacted will mostly be used to draw down debt, and not actually spent. Businesses all over the world are going to have to rethink their growth plans to the extent that they were based on ever-rising US consumer spending. Earnings are going to be under real challenge in most industries. This is going to become more obvious as time goes by, and is going to challenge whatever bear market rally can be mounted.
All is not gloom and doom. The last major recession and problem period, in the '70s, saw a number of new businesses start and prosper (Microsoft, Apple, Intel, etc.). Businesses that have access to capital are going to be able to take market share and come out of this recession in much better shape. It is just a recession, after all, and will end. But I would suggest keeping your powder dry and being nimble. There are opportunities which will arise, as they do in every downturn. Just don't expect this recession to be like any past recession. Make your plans accordingly.
Make a note. I showed a chart a few months ago which illustrated that imports were falling, even as the trade deficit was not. This was because of the high price of oil. Oil at that time accounted for two-thirds of the trade deficit. When they tally the trade deficit for November in a few months, I think everyone will be surprised at how much the trade deficit has fallen.
This is something we will discuss in a future letter, as a lower trade deficit means there will be fewer dollars to buy US debt, just at a time when US debt will explode. That means that US citizens must save and buy that debt, or the Fed will have to monetize it, or rates will have to rise to attract capital. These are somewhat counterintuitive concepts and need explaining. But not this week. It is time to hit the send button.
New York, Birthdays, and Moving
I will be in New York next month (December 4) for Festivus, a holiday fundraiser sponsored by my friends at Minyanville.com. If you are there, be sure and look me up.
My #2 daughter, Melissa, turns 28 today. How do they grow up so fast? She is my wild child, though in recent years she has started to turn almost conventional in a few ways. We are going to celebrate her birthday next Monday evening with family and her friends, which will make for a very fun evening.
Moving both home and office in the space of two weeks is starting to look like rather a serious logistical challenge. While the home I will be leasing is large enough, so we can have room for my office (along with my small staff), it seems that I have way too much furniture between home and office. Not exactly a good market to try and get rid of used office furniture. And all those files? And an extra washer and dryer? Oh, well. Good problems to have.
Have a great week.
Your trying to figure out how to grow his business in this recession analyst,
By John Mauldin
John Mauldin, Best-Selling author and recognized financial expert, is also editor of the free Thoughts From the Frontline that goes to over 1 million readers each week. For more information on John or his FREE weekly economic letter go to: http://www.frontlinethoughts.com/learnmore
To subscribe to John Mauldin's E-Letter please click here:http://www.frontlinethoughts.com/subscribe.asp
Copyright 2008 John Mauldin. All Rights Reserved
John Mauldin is president of Millennium Wave Advisors, LLC, a registered investment advisor. All material presented herein is believed to be reliable but we cannot attest to its accuracy. Investment recommendations may change and readers are urged to check with their investment counselors before making any investment decisions. Opinions expressed in these reports may change without prior notice. John Mauldin and/or the staff at Millennium Wave Advisors, LLC may or may not have investments in any funds cited above. Mauldin can be reached at 800-829-7273.
Disclaimer PAST RESULTS ARE NOT INDICATIVE OF FUTURE RESULTS. THERE IS RISK OF LOSS AS WELL AS THE OPPORTUNITY FOR GAIN WHEN INVESTING IN MANAGED FUNDS. WHEN CONSIDERING ALTERNATIVE INVESTMENTS, INCLUDING HEDGE FUNDS, YOU SHOULD CONSIDER VARIOUS RISKS INCLUDING THE FACT THAT SOME PRODUCTS: OFTEN ENGAGE IN LEVERAGING AND OTHER SPECULATIVE INVESTMENT PRACTICES THAT MAY INCREASE THE RISK OF INVESTMENT LOSS, CAN BE ILLIQUID, ARE NOT REQUIRED TO PROVIDE PERIODIC PRICING OR VALUATION INFORMATION TO INVESTORS, MAY INVOLVE COMPLEX TAX STRUCTURES AND DELAYS IN DISTRIBUTING IMPORTANT TAX INFORMATION, ARE NOT SUBJECT TO THE SAME REGULATORY REQUIREMENTS AS MUTUAL FUNDS, OFTEN CHARGE HIGH FEES, AND IN MANY CASES THE UNDERLYING INVESTMENTS ARE NOT TRANSPARENT AND ARE KNOWN ONLY TO THE INVESTMENT MANAGER.
John Mauldin Archive |
© 2005-2022 http://www.MarketOracle.co.uk - The Market Oracle is a FREE Daily Financial Markets Analysis & Forecasting online publication.


