Transitions From Stocks Bear Markets To Bull Markets
Stock-Markets / Stocks Bear Market Nov 04, 2008 - 07:59 AM GMTBy: Chris_Ciovacco
 From the tulip bulb craze in the 1630s to the dot-com bubble in the late 1990s, human beings continue to make the same mistakes over and over again.”
In a recent article, Stocks Will Bottom Well Before Economy , we conceded the outlook for the economy remains bleak, but the S&P 500's recent 46% decline has already priced in much of the bad news. Presently, we remain in a bear market, which means principal preservation is the primary objective. However, the recent declines in stocks have dropped valuations to levels where buyers will be more inclined to step forward. At some point, stocks will begin to transition from a bear market back to a bull market. It could occur relatively soon or may not happen for an extended period of time. Regardless of when the shift occurs, it is prudent to prepare for the transition.
Concepts Apply To All Asset Classes
The basic concepts discussed below apply to all asset classes, not just U.S. stocks. Therefore, if you are bearish on the U.S. dollar or if you are a long-term commodity bull, you can use charts and moving averages to monitor the health of these markets as well.Bulls and Bears Can Always Make Their Case
Even during the most bullish of bull markets, it is possible to find enough information to build what appears to be a very strong bearish case. Conversely, bulls can selectively find information and historical data to support an approaching bottom during the most difficult bear markets. Global financial markets have a lot of moving parts, such as money flows, exchange rates, credit availability, economic stability, sentiment, regulatory risk, government intervention, earnings, valuations, money supply growth, etc. As a result, it is nearly impossible for any one person or organization to fully encapsulate all the factors affecting financial markets into any forecast, bullish or bearish.
This is why it is very important to keep an open mind about all possible outcomes, even outcomes which are contrary to your view of the world. During a bull market, it is dangerous to become blindly bullish, especially after spectacular gains. Likewise, during a bear market, it is dangerous to become blindly bearish, especially after significant declines. The S&P 500 lost 46% of its value from the October 2007 highs to the October 2008 lows. While the current bear market could continue for years, it could also be closer to its end than many are willing to even remotely concede. An open mind is an investor's best friend.
Why Do We Look At Charts?
Charts are a good way to keep tabs on the human emotions of greed and fear. People have been greedy and fearful since the beginning of time. From the tulip bulb craze in the 1630s to the dot-com bubble in the late 1990s, human beings continue to make the same mistakes over and over again. Since greed and fear influence our decisions in 2008 the same way they did in the 1630s and 1990s, we can expect markets to make tops and bottoms in similar ways for centuries to come. During bear markets, one of the mistakes people have made over and over again is to remain overly fearful for too long as assets became attractively priced. Rather than stepping in to start some cautious buying, most people never consider moving some money off the sidelines when assets are much cheaper. People want to buy at the top and sit on their hands at market bottoms. It has always been that way and it will always be that way. Bottoms do not occur when conditions are perfect and it feels comfortable to invest.
Blindly Bearish Investors May Miss Opportunities
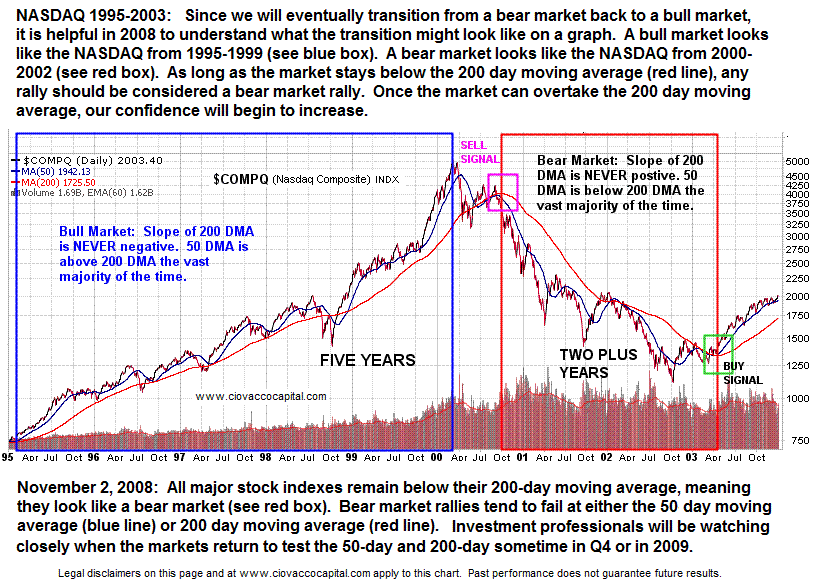
No one can consistently forecast the direction of financial markets, including you and me. Therefore, rather than building our own bullish or bearish bias, we should continue to gather the facts, conduct research, and form an opinion while conceding we could be wrong. A patient and observant investor should approach the markets with an educated and open mind, paying close attention to what has happened and what is happening rather than placing an undue emphasis on forecasting. All we can do is process the information we have now, understanding the information will change in the future. The chart below illustrates it is not all that difficult to discern between a bull and bear market using simple moving averages.
Choosing Which Bear Markets to Study
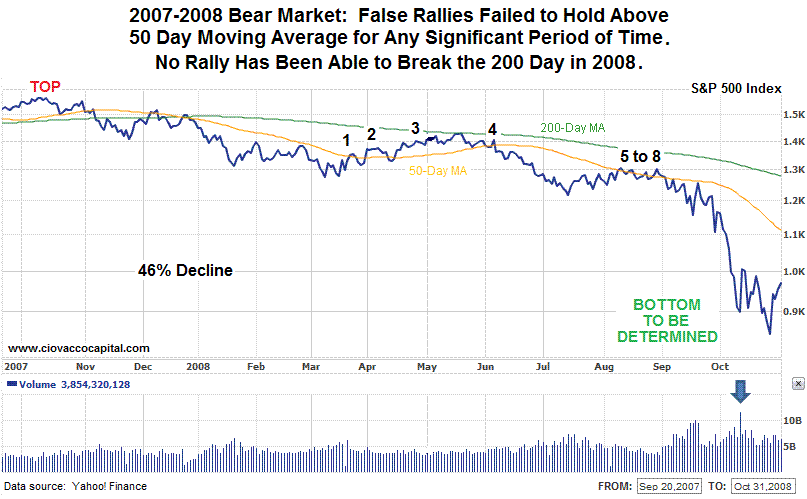
During the last 60 years, bear markets in U.S. stocks ended in 1947, 1949, 1953, 1957, 1960, 1962, 1966, 1970, 1971, 1974, 1978, 1982, 1984, 1987, 1990, 1998, and 2002. The two which are most similar to the current bear market in terms of the severity of the declines are the 1973-1974 and 2000-2002 bear markets. The 2000-2002 bear market declined 49% before finding a bottom. The 1973-1974 bear market declined 48% before finding a bottom. The 2007-2008 bear market declined 46% from the October 2007 closing peak to the October 2008 closing low (using the S&P 500).
2000-2002 and 1974-1975 Bear Markets
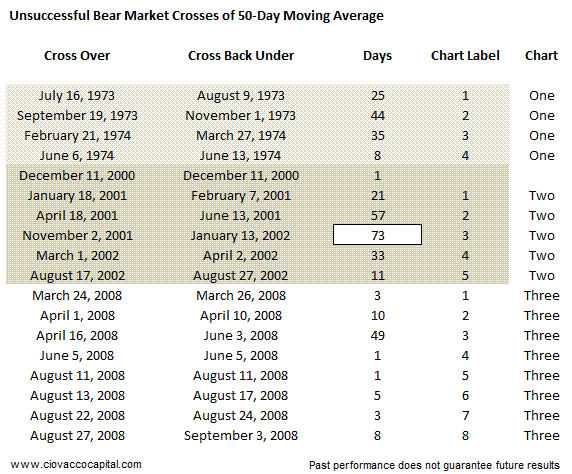
A closer look at the 2000-2002 dot-com bust shows how bear markets have trouble staying above the 50-day (orange line) and 200 day (green line) moving averages. The false rallies, which were able to stay above the 50 day moving average for a time, are labeled with numbers in Charts One, Two, and Three below. The false rallies which were able to stay above the 200 day moving average during bear markets are labeled with letters.
Chart One
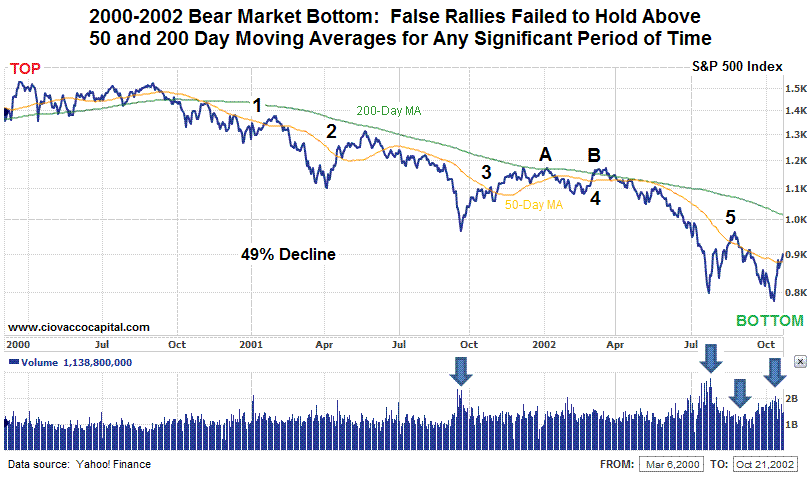
Chart Two
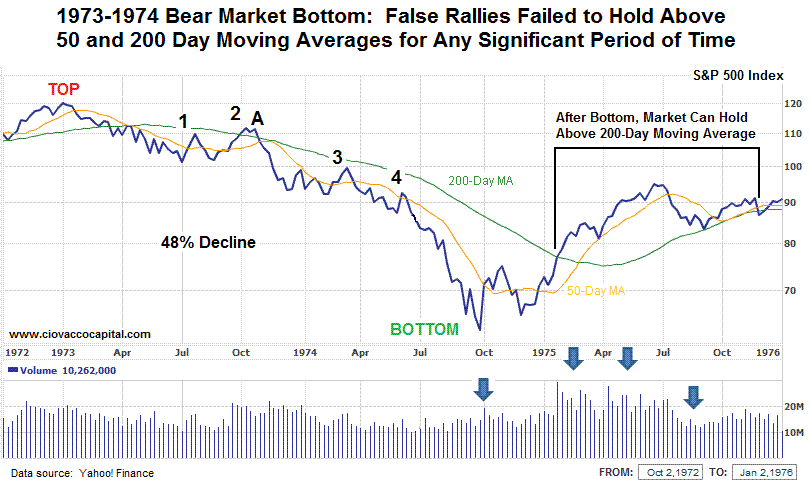
Chart Three
The important point is the number of days the market is able to hold above either the 200 day or 50 day moving average. In bear markets, the number of days is limited since subsequent declines eventually drag the markets back below their moving averages. However, when the bear market ends, stocks are able to hold above their moving averages for an extended period. Therefore, the longer the market can remain above the moving averages, the more confident we can become in putting capital at risk. During the 1973-1974 and 2000-2002 bear markets, the longest stay above the 50-day moving average was 73 calendar days.
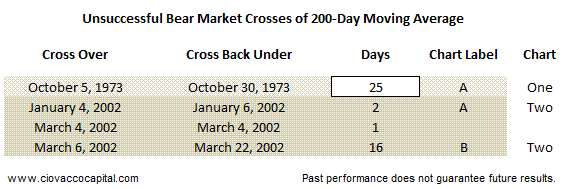
Similarly, the longest stay above the 200 day moving average during the 1974-1975 and 2000-2002 bear markets was only 25 calendar days. If the 2008 market can rally and hold above the 200 day moving average for more than 25 calendar days, it would increase the odds of a sustained advance. The future will be different from the past, but it is not unreasonable to expect some similarities since the charts are a simple way of tracking the human emotions of greed and fear.
Making a Bottom is a Process Which Takes Time
The chart below shows the S&P 500 Index from 1999-Present. It compares the bottoming process after the 2000-2002 bear market to the current bear market.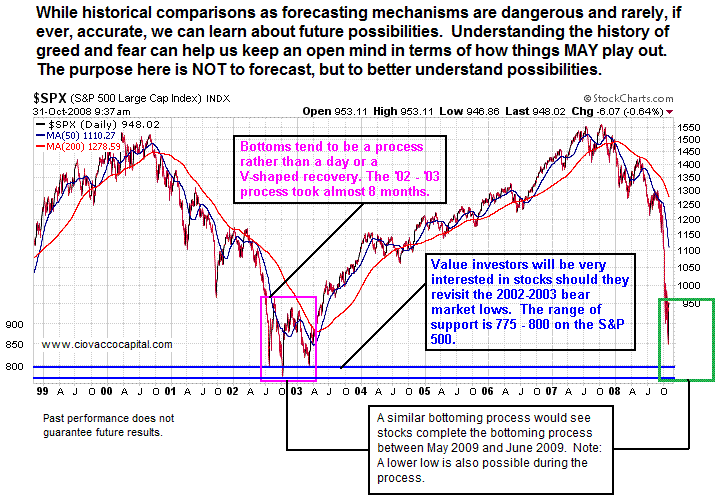
Watching With An Open Mind
Given current valuations and recent technical developments, it is no longer prudent to only entertain the possibility of more losses for stocks. Enough evidence now exists to accept the possibility of better times ahead for investors, while respecting the risks which clearly remain. A large cash position remains prudent, but a strategy should be in place to redeploy capital should markets surprise on the upside for an extended period.
Positive Trends Will Emerge In Some Asset Classes
These concepts apply to all asset markets, including oil, gold, and currencies. Every bear market in history was associated with big problems. Big problems are what set bear markets in motion. The fact that we have big problems today does not make the current bear market unique. If the markets continue to decline, we can offset the risk with our large allocation to cash and via hedging strategies, such as using put contracts. As stated in the opening paragraph, we remain in a bear market, which means principal preservation is the primary objective. However, with the recent bloodbath in almost all asset classes, positive and profitable trends will emerge somewhere whether in stocks, commodities, or currencies.
By Chris Ciovacco
Ciovacco Capital Management
Copyright (C) 2008 Ciovacco Capital Management, LLC All Rights Reserved.
Chris Ciovacco is the Chief Investment Officer for Ciovacco Capital Management, LLC. More on the web at www.ciovaccocapital.com
Ciovacco Capital Management, LLC is an independent money management firm based in Atlanta, Georgia. As a registered investment advisor, CCM helps individual investors, large & small; achieve improved investment results via independent research and globally diversified investment portfolios. Since we are a fee-based firm, our only objective is to help you protect and grow your assets. Our long-term, theme-oriented, buy-and-hold approach allows for portfolio rebalancing from time to time to adjust to new opportunities or changing market conditions. When looking at money managers in Atlanta, take a hard look at CCM.
All material presented herein is believed to be reliable but we cannot attest to its accuracy. Investment recommendations may change and readers are urged to check with their investment counselors and tax advisors before making any investment decisions. Opinions expressed in these reports may change without prior notice. This memorandum is based on information available to the public. No representation is made that it is accurate or complete. This memorandum is not an offer to buy or sell or a solicitation of an offer to buy or sell the securities mentioned. The investments discussed or recommended in this report may be unsuitable for investors depending on their specific investment objectives and financial position. Past performance is not necessarily a guide to future performance. The price or value of the investments to which this report relates, either directly or indirectly, may fall or rise against the interest of investors. All prices and yields contained in this report are subject to change without notice. This information is based on hypothetical assumptions and is intended for illustrative purposes only. THERE ARE NO WARRANTIES, EXPRESSED OR IMPLIED, AS TO ACCURACY, COMPLETENESS, OR RESULTS OBTAINED FROM ANY INFORMATION CONTAINED IN THIS ARTICLE. PAST PERFORMANCE DOES NOT GUARANTEE FUTURE RESULTS.
Chris Ciovacco Archive |
© 2005-2022 http://www.MarketOracle.co.uk - The Market Oracle is a FREE Daily Financial Markets Analysis & Forecasting online publication.


