


US Presidential Election Year Equity Performance in the Presence of an Inverted Yield Curve
Stock-Markets / Stock Markets 2024 Apr 25, 2024 - 11:19 AM GMTBy: Submissions

We have been hearing financial media pundits tells us that the stock market will continue to rise throughout 2024. One of their arguments is that we are in a presidential election year. The link between the stock market and the election cycle is simply that the incumbent party increases fiscal spending to stimulate growth and make Americans feel better about the economy, and hence the chances of the incumbent party getting re-elected. More spending is good for firm profits, and stocks rise. The Biden administration is certainly adhering to this tradition with massive fiscal spending in 2024.
At the same time, we have been watching the historic inversion of the Treasury yield curve, both in terms of duration (466 days and counting) and depth (over -100 bp on the 10-year/2-year spread last year). Our question is: how has yield curve behavior impacted the Presidential Cycle in the past?
To examine this question, we took all the available Treasury yield data back to 1976 and looked at yield curve inversion, flattening, and steepening during presidential election years. We plotted the 10-year/2-year Treasury curve using Federal Reserve Economic Date (FRED).
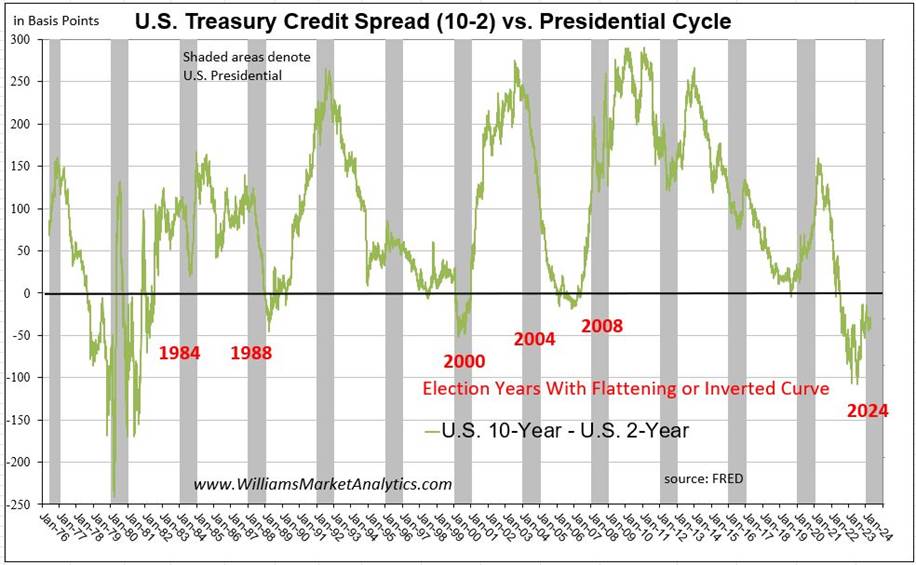
The shaded areas correspond to presidential election years. We separated out the years where the yield curve was flattening or stayed inverted during the presidential election year. In years where the yield curve both flattened and steepened, such as 1980, 1984, 2008, 2012 or 2016, we only retained the cases where the January 1 to election day movement in the curve showed significant (greater than 25 bp) flattening.
Next, we take the S&P 500 as a proxy for the U.S. stock market. The first chart below plots the composite cycle for all presidential election years since 1976.
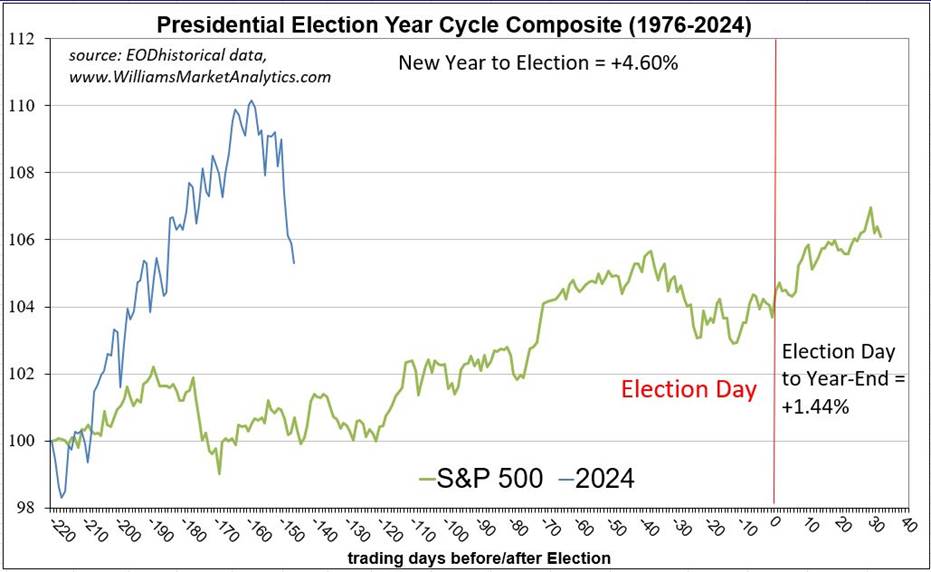
Indeed, the glide path (in green) is higher throughout the year. This suggests that vote-conscious politicians do behave differently in the run-up to elections, either through their positive rhetoric or through outright fiscal stimulus measures. Gains are historically front-loaded in presidential election years, with the mean S&P 500 gain up to election day being +4.60%. The year-end rally is still good, with a mean return of +1.44% over November-December. In these types of composite charts, trend is more important than level. Typically, we do see a March swoon in equity prices, then a longer pull-back in late summer.
We overlaid the 2024 S&P 500 price in blue (through April 17). Clearly the current equity performance is “off-trend”, with the early-year swoon beginning over 30 days late. If history holds, we should see a choppy up-trend into mid-summer before another, longer duration decline in equity prices.
Let’s now add our analysis of the presidential cycle considering also the behavior of the yield curve. Recall, an inverted/flattening yield curve has historically preceded periods of economic weakness and recession. Why? The central bank raises short-term rates to cool inflation as the economic expansion stokes aggregate demand and prices. The bond market, which influences the long-end of the curve, then begins to anticipate a slowing economy from restrictive monetary policy. Traders buy long-dated bonds for the safety, pushing long yields down. This is a “flattening” of the yield curve.
We first show the composite S&P 500 performance in “normal” yield curve years, that is, when the 10/2 spread steepened from January 1 to election day and/or remained un-inverted for the year.
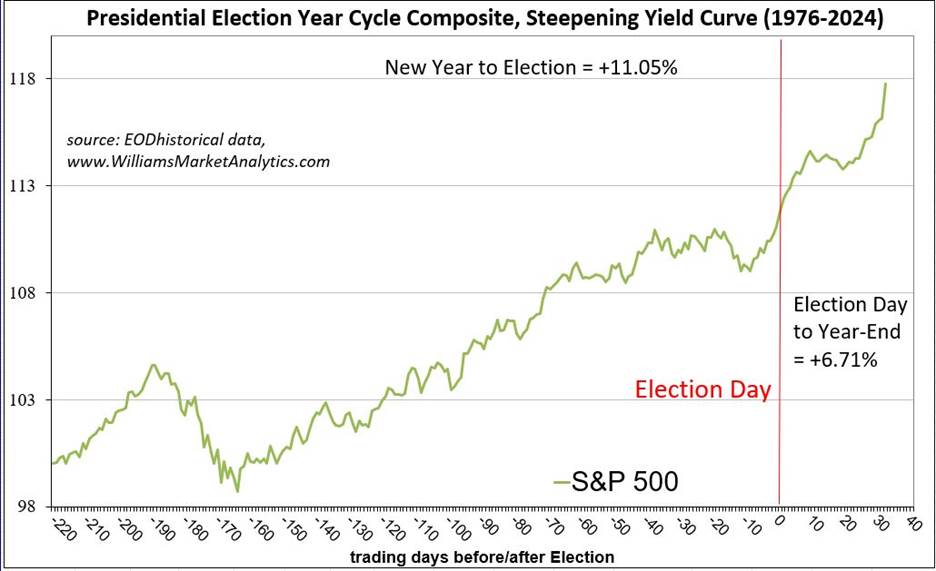
The glide path of the S&P 500 surprised us. While we did see the typical March swoon in equities, the late summer pull-back pre-election was very short. In terms of historical performance, we measured a +11.05% S&P 500 return from January 1 to election day. The last two months of the year were extremely strong for equities, +6.71%.
Next, we show the S&P 500 performance for inverted yield curve years, or years in which the 10/2 spread flattened from January 1 to election day.
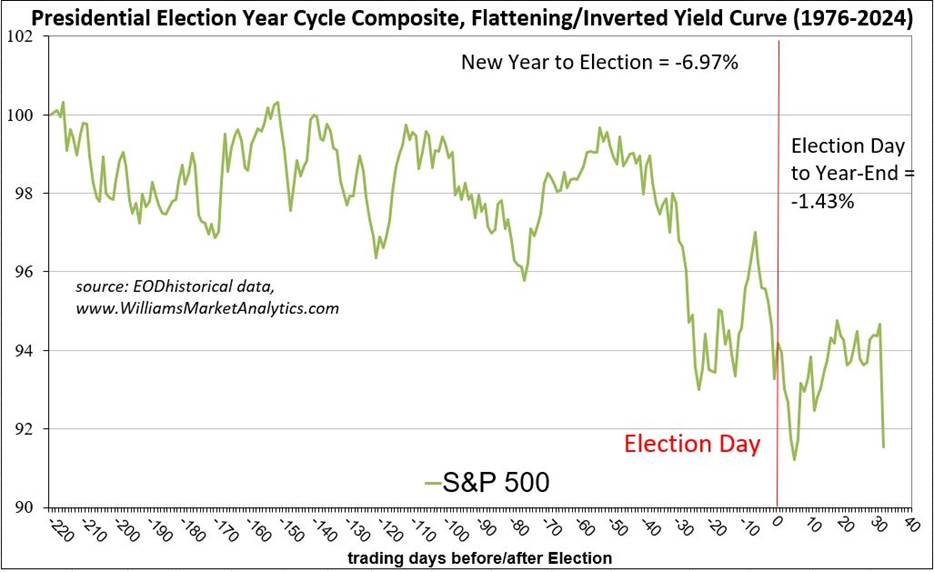
Again, the results were surprising, especially given the contrast. Equity performance has been very mixed in the first half of the year. The trend lower then begins in May thereabouts, followed by a summer bounce. Then in the 2-3 months prior to the election, the direction of equities takes a sharp turn south. In terms of mean S&P 500 performance, the index is down -6.97% from January 1 to election day. Then in the last two months of the year we don’t get the year-end rally, with the S&P 500 down an additional -1.43%.
Conclusion
We asked the question whether the 4th year of the presidential cycle is positive for equities, in light of the behavior of the yield curve. Overall, presidential election years have been good for equities. However, when isolating normal/steeping yield curve years from inverted/flattening yield curve years, the results are quite contrasting. It appears that the behavior of the yield curve may be more determinant for the performance of equities than just the fact of being in an election year (with the fiscal stimulus that this entails). Moreover, the composite S&P 500 performance in inverted/flattening yield curve years differs pre and post-election. One hypothesis is that the relative strength pre-election (at least up to 2-3 month out from the election day) is due to the fiscal stimulus off-setting the foreboding signal of a flattening/inverted yield curve. As fiscal stimulus winds down with the approach of election day, the yield curve worries dictate equity performance.
So what about 2024? As most market observers agree, we are in exceptional times. Monetary policy is nominally restrictive. Interest rates are high, but below levels suggested by measures such as the Taylor Rule, while liquidity (Fed balance sheet) is still very accommodative. Meanwhile, fiscal stimulus is astounding. The federal government spending is greater than seen historically in recessionary periods (in which counter-cyclical fiscal spending is supposed to be high). While history does not repeat itself, it does rhyme. In 2024 the 10/2 yield curve has flattened modestly from mid-January (-14 bp) until April 17 (-34 bp), all-the-while maintaining its 20-month inversion. While the yield curve could rapidly begin un-inverting between now and election day via Fed rate cuts (putting 2024 among the strong presidential years for equities), it appears that 2024 is setting up to be a weak presidential election year for equites. As is usually the case, it is interest rate behavior that will drive equites. Investors are well-advised not to get hung up in the positive rhetoric due to our presence in an election year.
By Owen WIlliams
Owen Williams is professor of finance at the EM Lyon Business School. He holds a PhD in finance from the Grenoble Ecole de Management and is a CFA charterholder. His research interests include asset pricing, currency markets, and portfolio theory.
© 2023 Copyright Owen WIlliams - All Rights Reserved
Disclaimer: The above is a matter of opinion provided for general information purposes only and is not intended as investment advice. Information and analysis above are derived from sources and utilising methods believed to be reliable, but we cannot accept responsibility for any losses you may incur as a result of this analysis. Individuals should consult with their personal financial advisors.
© 2005-2022 http://www.MarketOracle.co.uk - The Market Oracle is a FREE Daily Financial Markets Analysis & Forecasting online publication.