Stock Market Election Year Five Nights at Freddy's
Stock-Markets / Stock Markets 2024 Apr 07, 2024 - 02:15 PM GMTBy: Nadeem_Walayat
Dear Reader
Remember the start of the 2024? That opening dip in the S&P that had the likes of the holy church of the Almanach warning of the Trifecta of failures starting with the Santa Rally, then the first 5 days, with eyes next on the January baromoter, harbingers for a bad 2024 for stocks!
This was my Five Nights at Freddy's response to the headless chickens that was first made available to patrons who support my work. So for immediate first access to ALL of my analysis and trend forecasts then do consider becoming a Patron by supporting my work for just $5 per month, this is your last chance to lock it in now at $5 before it soon rises to $7 per month for new sign-ups. https://www.patreon.com/Nadeem_Walayat.
And imagine if one had followed my lead with a model crypto portfolio for whose who held nothing Mid Janaury when Bitcoin was $42k vs $67k today, Solana $90 vs $175 today, and don't even get me started on MSTR up from $480 to $1440 today!
Model Crypto Portfolio
If I was at zero then I would look to achieve the following allocation -
- 30% Bitcoin
- 20% Solana
- 15% Link
- 5% Eth
- 5% Ada
Stock Market Election Year Five Nights at Freddy's
Santa Rally FAIL! First Five Trading Days FAIL! Next January Barometer FAIL? Would be a Trifecta of FAILS which has got many analysis running around like headless chickens! even into the comments section of my latest post in response to which I commented early last Tuesday -
Lots of twitter headless chickens over failure of first five trading days..... Next failure could be January ....... which could sow the seeds for another one of those rip the face of the bears rally..... Though my base case is that comes post election, but your never know when so many are so wrong...... Working on Next article titled "Stock Market Five Nights at Freddy's Indicator" cos investors are easily scared.....
This is the problem with so called analysts they run with stuff such as the above studies without context! One indicator on it's own no matter what it is will just be a coin flip.
These are the facts, we have had an spectacular bull run off the October 4100 low, well beyond my 4600+ expectations that came within a whisker of setting a new all time high, so as I have been stating that the move about 4600 is frothy. Yes it would be great if we continued higher into the end of January that and had a santa rally and UP First Five Days happened for a bullish Trifecta to reinforce expectations for a bullish 2024, but it was just a 50/50 proposition given where we were coming into 2024 i.e. in an overbought state which means for stocks to go higher they have to become even more overbought. Yes it is possible but it's marginal unlike late October which was a very strong probability that we would see a rip your face off rally to above 4600, whilst going from 4770 to 4820+ despite being near is a tough climb.
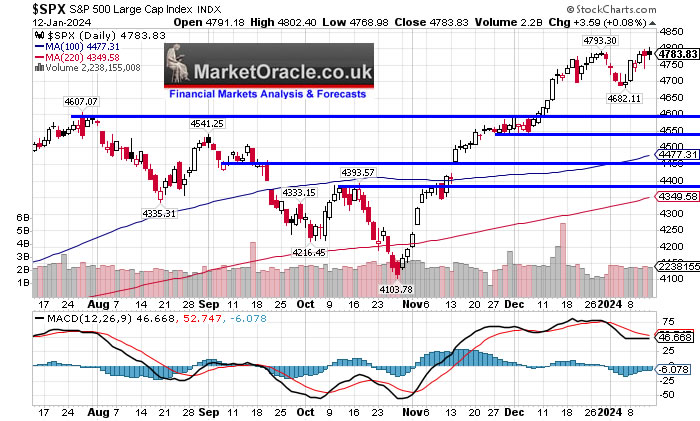
Current state of the Market is that we are in a trading range of between 4800 and 4600, which is inline with my expectations for Q1, i.e a correction in Q1 off a late Jan high that early January was just a taste of what's to come and given that we are perched towards the top of the range and entering OPEX week then this week should see a downwards bias in the S&P i.e. probably trade down to below 4700 to target the 4660 low.
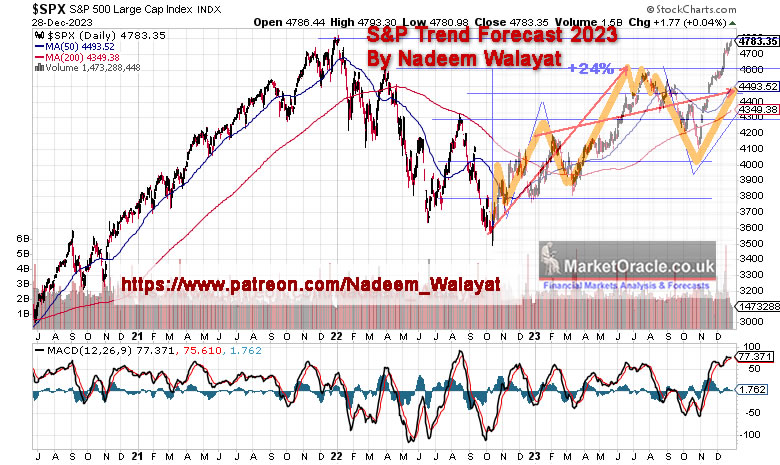
S&P Stock Market Analysis, Detailed Trend Forecast Jan to Dec 2024
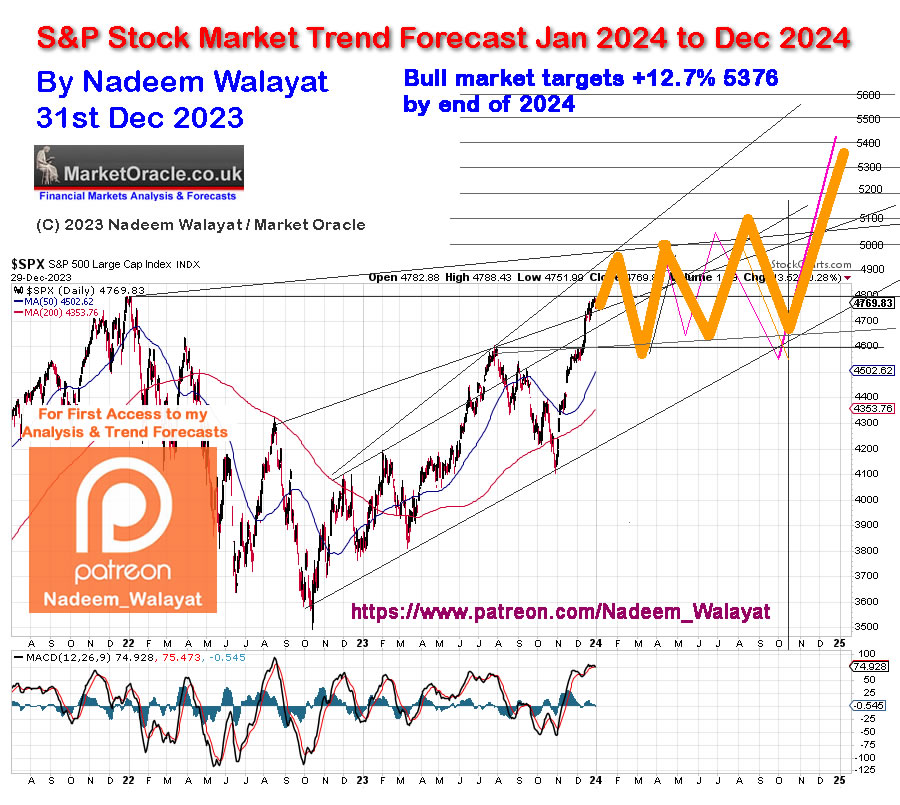
So taking where we stand and the trend forecast road map then we should see the coming OPEX week as being a DOWN week for the S&P followed by an UP week at least into the end of the month to deliver a marginally up or down January. Though as I often state we are in a bull market where the risks are to the upside, all it takes is a breakout above 4820 that no one is expecting right now for a rip the face off the bears rally to well over 4900, so don't make the misatake of going short!
Folks tend to get overly jittery over nothing burger price actions. Look virtually every year stocks see a deviation lower against the start of the year by typically 10%. Which means that when the dust settles we will probably see the S&P trade a lot lower than the early January low, maybe even as deep as -10% which could see the S&P trade as low as a 4300 on failure of a series of support levels as indicated in the first chart, which would be normal price action as that is what the S&P tends to do more often then not and STILL end the year higher. So we will get some decent buying opps in target stocks just as we did last year where this year will be more volatile i.e. deeper retracement's before the post election blast off as per the road map. To illustrate this point we could see the years low made in March, June or even October, though my base case is March but subsequent lows won't be that far off of it.
Five Nights at Freddy's Indicator
I call it Five Nights at Freddy's instead of the first five trading days because so many investors frightened themselves to death over nothing. The disciples of Hirsch and the holy church of the Almanac are in full flow on twitter preaching doom and gloom from the pulpits. This illustrates the problem when folks take things out of context.

As does Hirsch so do I crunch the numbers for the likes of the Santa rally, First Five Days, January Barometer and so on where more likely than not my skewed interpretation more often then not tends to result in a differing expected outcome, so even when using near enough the same data one tends to get a different result!
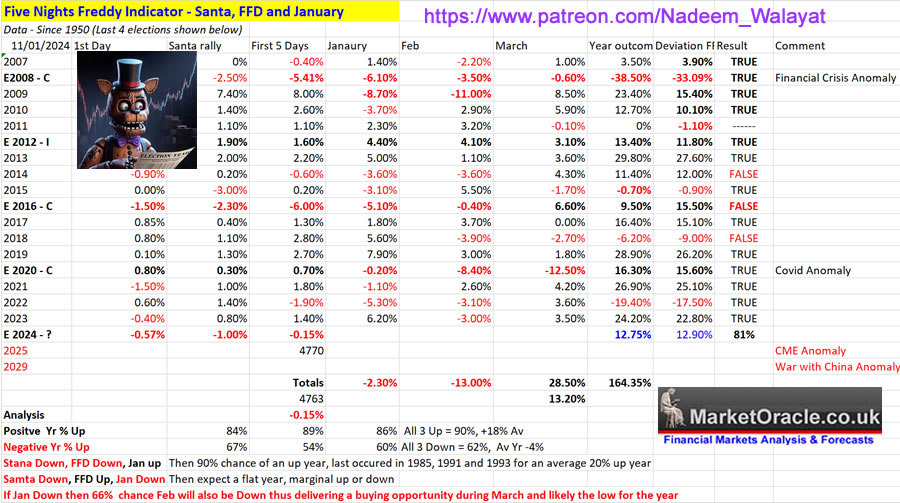
So what is that everyone's missing that's literally staring them in the face? -0.15%, MINUS 0.15%! THAT is NOT a SIGNAL! That is NOISE! You don't run with on the basis of barely 10 S&P points to imply that the outlook for the whole of 2024 is done for on the basis of just noise!
It's Five Nights at Freddy's -0.15% for the cartoon network (CNBC) to use to scare the pants off the investing public that the disciples of Hirsch perpetuate across the blogosfear!
Instead what do I see in the most recent years as recency is most important, rather than harping back to what the S&P would have done had it existed 100 years ago!
2014 - FFD, Jan down = +12%
2015 - Santa, Jan Down = Flat year
Election Year 2016 = ALL 3 DOWN = +15.5% Where the stock market favours the incumbent winning over a New President, so those who want a very bullish year should pray for 80 year old Biden to make it back into the White house.
Now given where we are perched at the start of the year, YES even though it is not my base case January could end lower and thus deliver the bears a TRIFECTA SELL Signal. But for me it would not be in isolation because right now the stock market is in a trading range and IF it stays in the trading range then it is pot luck for whether it will be towards the upper end or the lower end of that range by the end of January, so it would not phase me or change anything, not unless we see a break of the lower end of the trading range, which would be a signal to take notice of. As things stand statically if all 3 are down then there is a 62% chance for an UP YEAR! If Jan comes in positive then this jumps to 90% chance with an average gain of 20%!
In fact as I alluded to earlier I would have a big smile on my face if the S&P ends January lower because then the lemmings would be ripe to have their bear faces ripped off for the whole of 2024 as the Trifecta comfort blanket that they cling onto would lead them to ruin as the market then does the exact opposite of what they thought was a done deal by eventually breaking higher, and so they will end up being wrong for the WHOLE: of 2024 just as they had been for the WHOLE of 2023.
However January is not over with where my base case is for January to end higher than where it started the year to resolve in a pattern of a Santa and FFD Down followed by an up January, a pattern that has repeated 3 times since 1950 in 1985, 1991 and 1993 that resulted in 100% UP years with an average gain of 20%! Whilst a Down January would just confirm expectations for a continuation of the downtrend into March.
At the end of the day we are potentially in for a rough 10 months, during which | expect the S&P to trade through it's 2024 opening level several times, so knowing that we will revisit 4770 several times gives one an advantage both when it either rockets above or drops below 4770 because it will eventually spring back through 4770 which is a huge advantage to know compared to those who will FOMO on breakouts higher and those who panic during the depths of the corrections to then be flummoxed when prices abruptly reverse to trend higher to above 4770 as just took place as price perception at the extremes will be that there is more to come, of course the S&P is just noise where investing is concerned as Tesla 's drop into it's buying zone illustrates, thought I still get comments, asking why is Tesla falling if S&P is going higher!
The bottom line is that the stock market entering 2024 was overbought, it needs to consolidate before it's ready to push higher in response to EARNINGS, so all of these arbitrary dates such as the end of Jan are coin flips in that they could mean something useful or they could be totally irrelevant depending on where the trend is relative to 4770, i.e. coming up through or down through as it springs along during 2024. As ever the real action will be in target stocks to both accumulate during draw downs and distribute during over exuberance where the only S&P level that matters for 2024 is 5376 as that is it's final destination.
AI Tech Stocks Portfolio
Current state of my AI stocks portfolio after heaving trimming is 84.5% invested, 15.5% cash having trimmed several stocks hard where the biggest changes vs Mid November are -
Qualcom 110% vs 126%, Micron 47% vs 67%
Broadcom 17% vs 45% - Not as deep as it sounds i.e. percent of portfolio is now 1.5% vs 2% a function of big trims i.e. buying below $500 and selling at $1160 results in a big drop in actual cash invested whilst not making much difference to percent of portfolio.
Intel 118% vs 130% , GPN 114% vs 141%, WDC 104% vs 122%, Roblox 112% vs 133%
Mostly a case of taking the opp to trim where I was heavily over exposed. Only real anomaly is Broadcom which may turn out to be a mistake i.e. maybe I sold too much, see I'm not perfect!
Though I did up crypto from 2.83% to 5.9%, so percent invested is 84.5% vs 86.5%.
The Q4 earnings numbers have been crunched resulting in EGF updates for most reported stocks where EGF gives the immediate outlook for Q4 earnings and 12M EGF a rough picture for the year ahead.
Google Portfolio spreadsheet
Patrons may not be aware that the spread sheet has several metric columns (apart from prices) that get updated several times a week and that the spread sheet link is valid for a couple of months when a new spread sheet link gets shared so as to keep access to the latest spreadsheet for patrons only at which time I will let patrons know.
https://docs.google.com/spreadsheets/d/13gDntQuyDP3db7WqEvOXftOxVVTJyYyB_s-O0XW2EIk/edit?usp=sharing
Looking at the portfolio what stands out is the disparity between the Primaries and the rest, the primaries virtually all have STRONG EGF's! Whilst the rest are a mixed bag, but mostly Reds, so weak in terms of earnings.
Best stocks in terms of the numbers (Dilution, EGF's., PE, Fundamentals) - META, Google, Broadcom , GPN , Baidu, Logitec, CRUS, NVDA, AMD IBM and Qualcom.
Worst stocks in terms of the numbers - Micron, Intel, WDC, Pfizer, Diode, GFS, Redfin....
Q4 Earnings Season
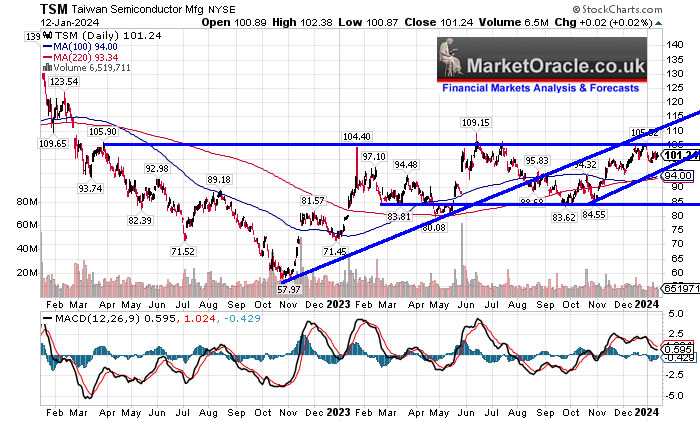
TSM - Thursday 18th Jan - $101 - EGF -5%, +3%, P/E 18, PE Range 40%
TSMC is the weakest of the Primary AI stocks with negative EGF's but it is the worlds primary cutting edge chip foundry so not one to be without exposure to. The stock basically plays follow the tech leaders within a range pending a breakout higher, waiting for inevitable signs of growing earnings to kick start it's bull run proper. The range suggests to accumulate sub $90 and trim above $105, though not over do the trimming and thus miss the eventual breakout that would first target $120 and then $140. I am 100% invested.
(Charts courtesy of stockcharts.com)
JNJ - Tuesday 23rd Jan - $162 - EGF -5%, +3%, P/E 18, PE Range 40%
Weak EGF's and moderate PE point to the stock continuing to trade in a trading range of between $180 an $150 with an upwards bias given that earnings are growing due to inflation whilst paying a 3% dividend.
RTX - Tuesday 23rd Jan - $86 - EGF -1%, 313%, P/E 17.2
A steady as she goes slow growing defence stock that pays a 3% dividend along the way. We can ignore the 313% EGF which is a statistical anomaly, tends to happen from time to time when using formulae's. More realistic equivalence would be a read of about +8%.
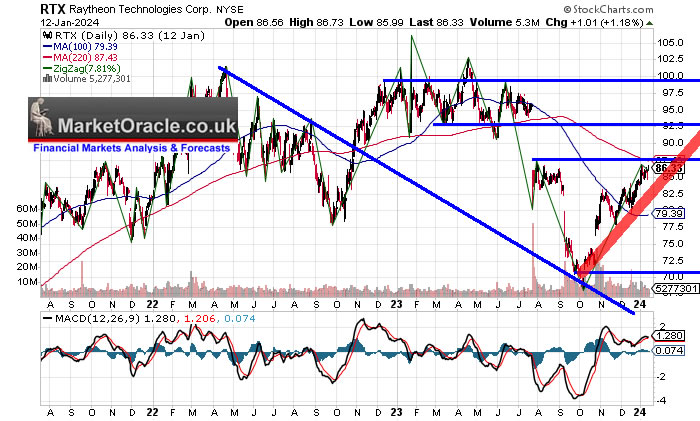
The stock at $86 is at the top of it's current range so upside is probably limited, whilst downside is also limited to about $72. Overall I would expect RTX to snake higher during the year towards $100. I am 58% invested and will likely add more at $72.
Netflix - Tuesday 23rd Jan - $492 - EGF +48%, +40%, P/E 49
Not a stock I hold but a favourite of many FAANG investors. Those are mighty fine EGF's though the PE is a bit spicy at 49 implies a lot of growth has already been priced in to the stock price.
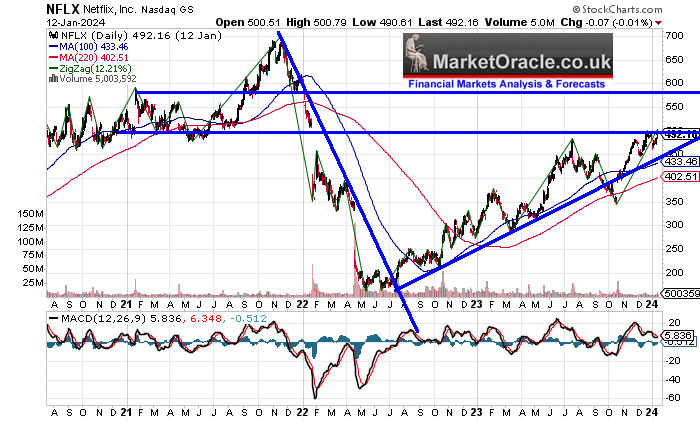
The stock price has had a spectacular bull run and it was one of those crushed like a bug stocks that I bought during 2022 as a trade at sub $200, which I would have mentioned at the time in at least the comments section. But it was a trade so long out of it at sub $300. The stock price is now hitting resistance along $500, it looks like it's going to have a tough time getting much higher during 2024, maybe $550 is possible, the easy money has been made the next 10% will be tough going. Bottom line: it should do well over the long run.
ASML - Wednesday 24th Jan - $713 - EGF 0%, 0%, P/E 35, PE Range 50%
ASML is pausing to catch it's breath in terms of earnings, the PE is fine in terms of it's PE range. So earnings wise I am not expecting any upwards surprises and given ZERO EGF's there is a fair chance of a downside surprise to present a buying opportunity.
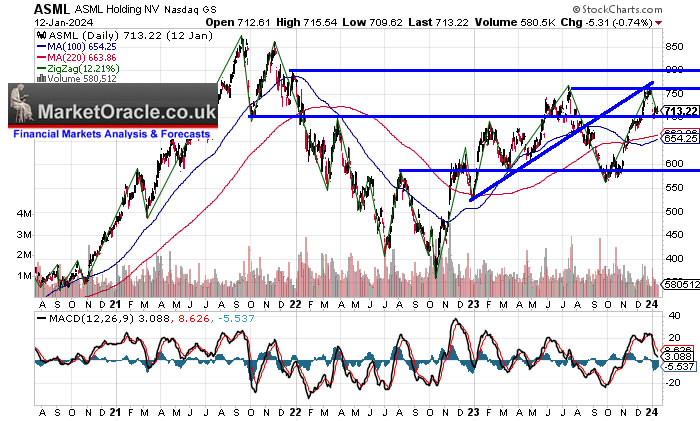
ASML is a great stock in terms of accumulating and trimming, giving plenty of opportunities to do both as recently on the dip below $600 it was a case of ramping up exposure to about 85% invested that now after trimming the rally sits at 71% invested ready to rinse and repeat on the next dip to below $600 that looks more probable than not given that EGF's are flat so a drop on earnings is more probable than not.
TSLA - Wednesday 24th Jan - $219 - EGF -20%, -2%, P/E 61, PE Range -1%
Tesla is a sleeping AI giant, you see why when one marries Tesla bot's with AI trained on their in house neural net DOJO supercomputers and what you get are walking talking working robots that I suspect will arrive within the next 2 years. Therefore I am primed to capitalise on this years buying opportunities in what will eventually become a primary AI tech stock. The EGF's are weak so suggest earnings disappointment and therefore a price dump.
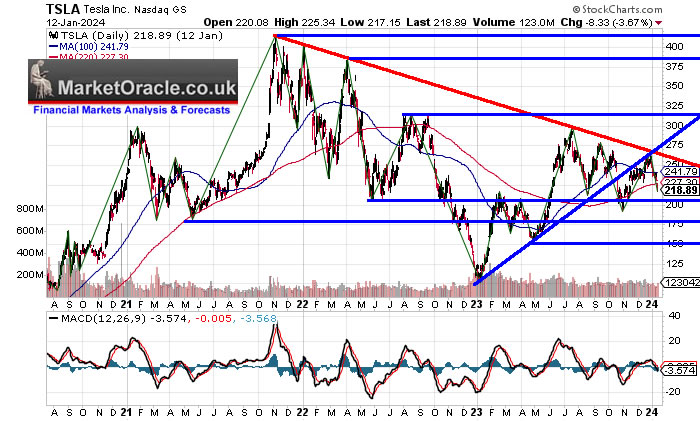
Tesla stock remains firmly in a downtrend which suggests a break lower to below $200 is more probable than not which means investors could be in store for a buying opp as the stock targets a trend to below $200 to $192, then $180, $160 and finally $150, which would be time to load up the back of the truck. I am 56% invested and will continue to accumulate as the stock price drops, the more it drops the more I will buy, for instance a year ago I was 170% invested which fell to about 25% on it's X3 to $300 during 2023, then started accumulating once more on the downtrend since.
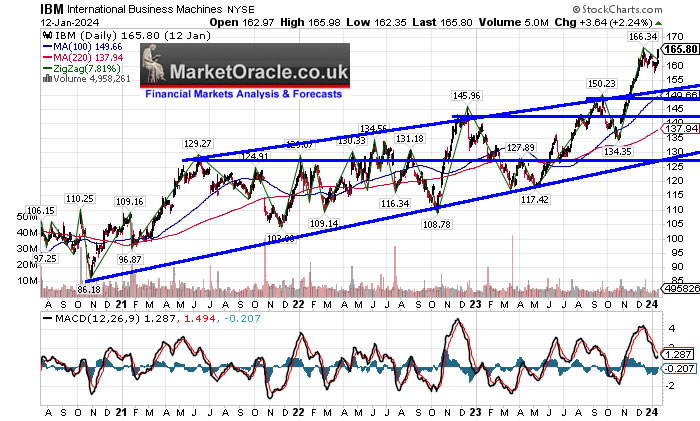
IBM - Wednesday 24th Jan - $166 - EGF 27%, 3%, P/E 17.8, PE Range 280%
The sleeper has awakened! EGF's are strong, PE is high in historic terms but not in terms of a sleeper waking up to fulfill it's destiny of potentially becoming numero uno! That's right the next Nvidia!
(Charts courtesy of stockcharts.com)
IBM trend is accelerating, the correction off of $166 was very very mild so far not allowing anyone waiting to buy to accumulate, the normal trend is for corrections to trade below the previous swing highs i.e to trade below $150, if IBM fails to do this then it's going to the MOON, $200! Leaving all those waiting to buy the dip with nothing! However given the looming Feb / March stock market correction then we may yet get that dip to below $150, which IF it happens would mean getting lucky as IBM has broken out of it's range. IBM has offered plenty of opps to accumulate over the past 2 years trading as low as $108 during 2022. I'll be seeking to accumulate more sub $153.
LRCX - Wednesday 24th Jan - $101 - EGF -9%, 0%, P/E 25, PE Range 120%
Lam Research is over extended in EGF terms, suggests a period of consolidation allowing for earnings to play catch up to the price.
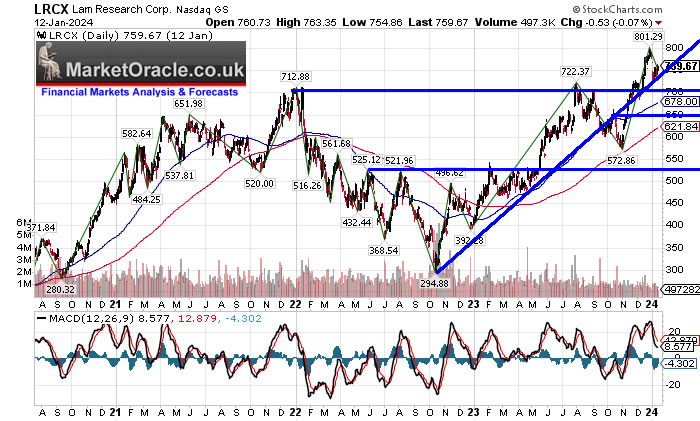
LRCX just like ASML has been a treat to trim and reaccumulate into as the recent drop below $600 illustrated, can't get much easier to read than that, i.e. a stock correcting off it's all time high to support along $550. The subsequent trend has been strong and once more put LRCX in an overbought state that targets a trend to below $700 and likely down to $650. Thus we should see another opportunity to accumulate for it's next push higher to beyond $800.
INTEL - Wednesday 24th Jan - $101 - EGF R183%, R135%, P/E 78, PE Range 3400%
Intel is another sleeper that is showing signs of waking up, though don't expect Intel to do an IBM anytime soon in terms of targeting new all time highs given how bad the metrics are, literally breaking the EGF's. With Intel it's a case of playing the long game which means that just like IBM Intel has the potential to become the next Nvidia.
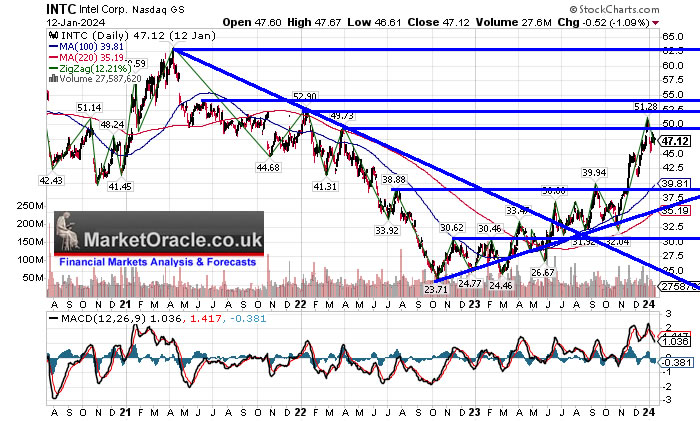
Whilst the stock price collapse to $23.7 was horrific, nevertheless the bounce back has caught off guard all those who had written Intel off as being DEAD. Even managing to briefly break above $50. Whilst I am not expecting new all time highs any time soon, nevertheless Intel should continue to trend higher during 2024 that targets a break of $62, beyond which new all time highs are only a matter of years away. My objective has been to trim over exposure from a peak of 140% invested to currently 118% which still places Intel as my 4th largest holding which shows the extent of my buying the falling knife, so I plan to continue to trim north of $50.
KLAC - Wednesday 25th Jan - $560 - EGF -3%, +2%, P/E 23, PE Range 118%
KLA flat EGF's and high PE should be primed to deliver a buying opportunity of sorts but the problem for all those looking to buy is that it is well run company that buys back a lot of its own stock which is why I think twice when contemplating trimming as the chances of being able to buy back at a lower price tends to be slim. All one can hope for is that earnings volatility delivers a buying opp.
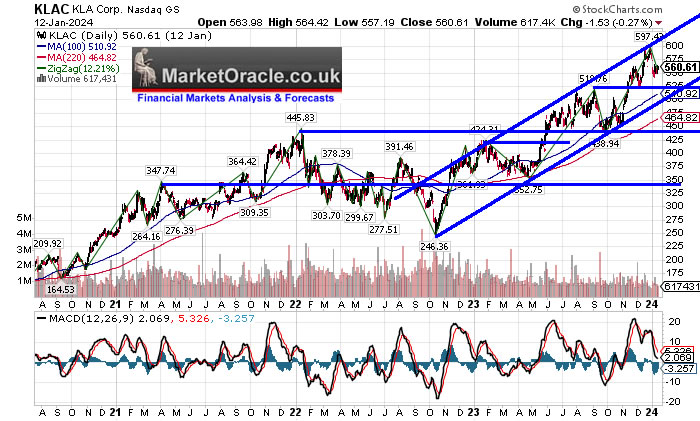
K:LAC should continue to unwind it's overbought state to target a trend down to the previous high of $519, lower than that would be a case of getting lucky. i.e. down to $450. I will be accumulating between $530 down and $470, with the aim of upping my current exposure from 60% to 70% invested.
WDC - Wednesday 24th Jan - $50 - EGF +5%, -125%, P/E -9
WDC has had very bad metrics for quite some time which did result in a stock price blood bath during 2022 taking the stock price down to $29, and I can't see why the stock price recently spiked to over $50 given that the company still makes losses, maybe someone is accumulating for a bid? Nevertheless I took the rally as an opportunity to trim hard by taking my exposure down from about 140% invested to 104%.
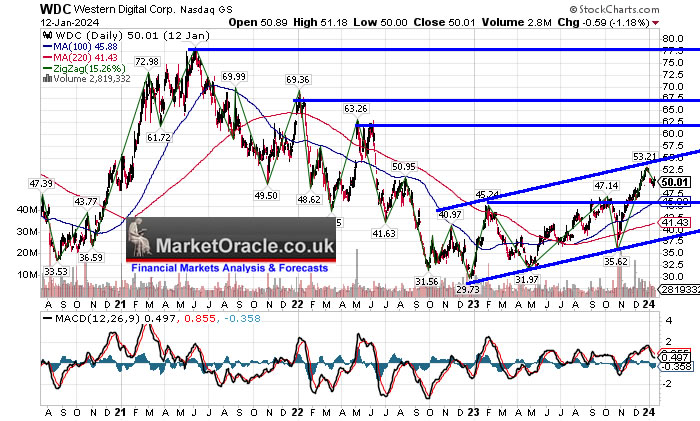
I suspect WDC is going to find it tough going to climb higher than the recent $53 high during 2024 given that WDC still reports losses. There is a real risk that WDC trades all the way back to below $40 where I will once more start accumulating again. On the upside I will continue trimming north of $52, until I see something positive on earnings front to justify a sustained bull to $60+. I am currently 104% invested and aim to reduce this towards 90% at between $52 and $60. WDC was one of those stocks that used to prompt patron worries on the drop towards $30, not anymore, now it's when will it fall to back below $40 so they can buy, that is life!
NVDA - Wednesday 28th Feb - $547 - EGF +96%, +87%, P/E 63, PE Range 64%
Nvidia's earnings may be over a month away but like most investors I'm eager for an opp to buy back in to a sizeable position in this AI monster. The EGF's say it all, we need to get lucky for any chance of getting this stock when cheap, in respect of which earnings season could deliver some volatility either going into Nvidia earnings or as a result of other AI stocks missing and thus tanking the whole sector.
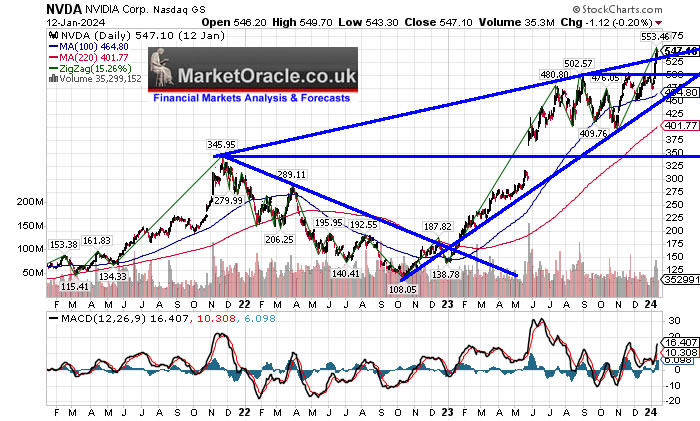
The buying range is $432 to $372 with the last close at 27% above the top of the range. Nvidia is a tough stock to accumulate into, a case of biting the bullet and DCA'ing and then hoping we get lucky on the next general stock market correction that is due going into March. I am currently just 1% invested vs 60% invested a year ago. I aim to accumulate between $440 and $396 should the opportunity arise.
Bitcoin Crypto's Get Rich Gift - Current State
As expected the Bitcoin ETF's were approved after some drama due to incompetence at the SEC with the so called hacked tweet announcing approval some 24 hours earlier. Though it looks like at least for the present time ordinary people are NOT being allowed to invest in the Bitcoin ETF's, you see how the game is played? YOU are NOT being allowed to invest in the Bitcoin ETF's! For now they are mostly for institutions, billionaires and nation states, you will only be allowed to join the bitcoin ETF party towards the end of the bull market when the rich are exiting via the backdoor. And it is a lot worse for UK investors were we have to go through the likes of MSTR to gain exposure to bitcoin in tax free wrappers, but as you will see MSTR is NOT the same as buying Bitcoin, similar but not the same.
Bitcoin dips 15% and folks are already panicking over a NOTHING BURGER! As I replied in response to the price drop -
If folks see a 15% dip as a problem then folks aren't going to make it to BTC $100k cos there will likely be several dips of 30% or more along the way.... I'll add a section to the article I am working on.
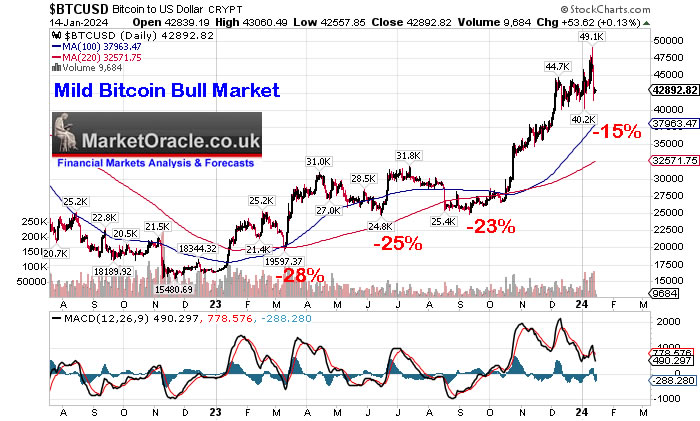
That's right if you are going to make it to $100k then you need the stomach for typical corrections of 30% and more as that is the norm of past bitcoin bull markets where corrections tended to average about 40%. In fact this bull market has been very, very mild! The corrections to date have typically been under 25% which is why so many so called Bitcoin experts have been caught off guard with corrections never going deep enough for them to accumulate into which is a sign of a very strong bull market that is not allowing folks wanting to buy the dips to accumulate into. Even today you go on twitter or youtube and you hear the current correction should / could trade down to $32k because that is what typically happened in past cycles, it is not going to do that! I suspect 15% is all those waiting are going to get as it looks like its gearing up to blast through $50k, just marking time for the moving averages to play catch up to unwind it's overbought state.
So in addition to DCA a simple buy the dip strategy would be to buy 15% deviations from the high. Though I am fully loaded so only seeking to add more in response to having trimmed earlier.
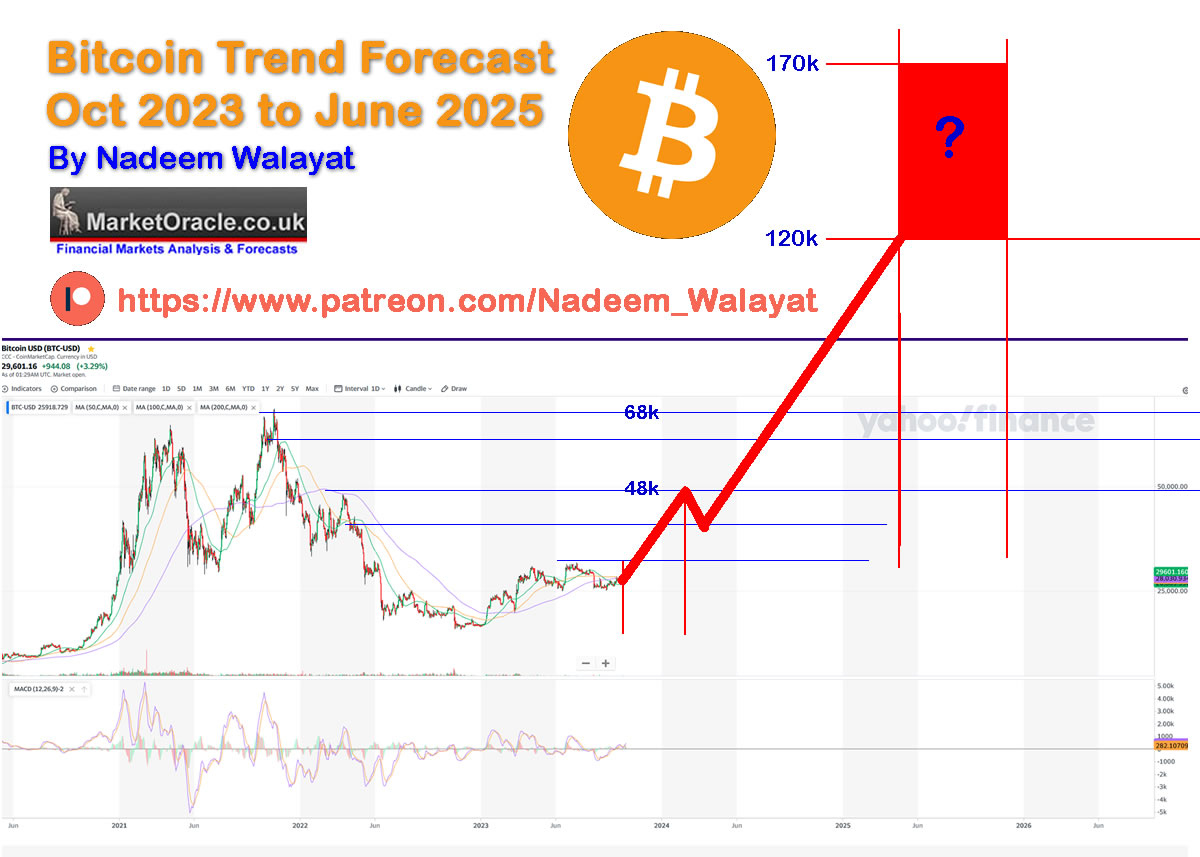
The bottom line is that Bitcoin price $43k up 70% on the $27k gift, continues to target $100k+ by a year from now. All one needs to do is to keep it simple by DCAing and buying any dips and then cash out north of $100k.
Bitcoin Trend forecast - Last Chance to Get on Board the Bitcoin Crypto Gravy Train - Choo Choo!
So here's my Bitcoin gift (trend forecast) that on the current price of $27k, Bitcoin will at least near X4 to $98k and likely a lot more than that, given that there will soon be a flood of Bitcoin ETF's hovering up limited supply of the NSA's, I mean Satoshi Nakamoto's crypto baby.
Large Image - http://www.marketoracle.co.uk/images/2023/Oct/Bitcoiin-Trend-Forecast-June-2025-Nadeem-Walayat.jpg
Model Crypto Portfolio
If I was at zero then I would look to achieve the following allocation -
- 30% Bitcoin
- 20% Solana
- 15% Link
- 5% Eth
- 5% Ada
Again all one needs to do is to DCA and buy any dips and then just sit back to cash out at $100k, it can't get much easier than that.
My crypto portfolio currently totals 5.9% of my portfolio.

Whilst all crypto are correcting post ETF however MSTR has taken a spectacular dump probably hastened by the fact that so many had placed options bets on MSTR soaring to above $700, apparently there was record volume on the $700 strike price. that expired 12th Jan! However the dump to below $500 is NOT of any surprise given how much FOMO had been pumped into MSTR as the BTC price divided by MSTR illustrates and it just goes to show how little research most market participants tend to do given all those who FOMO 'd into the $700 strikes that as I commented before the ETF announcement and MSTR price dump that they had near zero chance of winning on their bet.
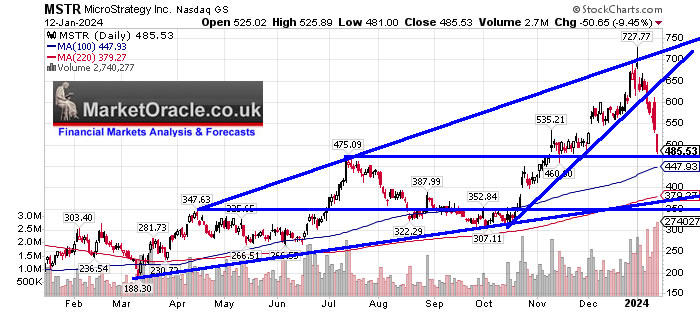
The metric I use to roughly track fair value for MSTR is the ratios 100 day moving average which is currently at 77. so Bitcoin price divided by 77 is the fair value price for MSTR that is currently 43100 / 77 = $560, which lets one know if one is over paying for MSTR, where MSTR moves in a range of about 100 to 65 so currently would have the very cheap end at 430 to the very expensive end of $663 of this range.
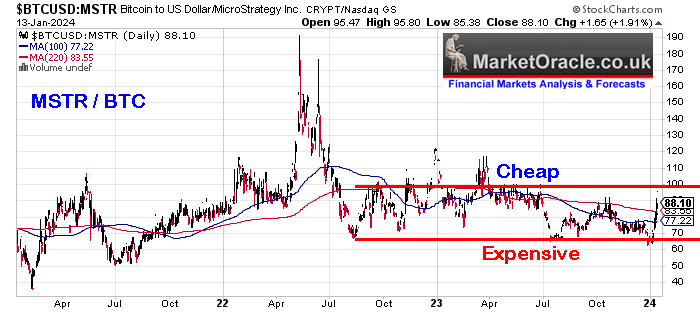
Therefore the current price of $485 is below fair value and thus cheap to accumulate relative to the bitcoin price as all those who had FOMOd into MSTR on the way up to $720 are getting wiped out. MSTR has achieved my target of trading below $500 where I had a big buy at $495, and yes it could continue trading lower to below $450 but it is now CHEAP in relative terms, and there will come a time when it will become expensive once more where even at div70 would now be trading at $615. Whilst at my minimum target for BTC that would put MSTR at $1420! And I suspect it will go a lot higher than that given that Michael Saylor is expert at pumping his own stock, $1800 would not surprise me! So in the big scheme of things whether one buys at $585 or $485 does not make that much difference given the potential of $1400+ Just that the ride is going to be very bumpy, not for those with weak stomachs or prone to getting caught up in FOMO.
Crypto's are crypto's, violent price moves are part and parcel of holding crypto's, where 30% corrections are the norm and I imagine we are going to see several 50% drops in alt coins during the bull market so as to wipe out all of the leveraged players. This is the name of the game the crypto exchanges play, FOMO runs higher then rug pull drops to wipe them all out as the MSTR stock price is a classic example of. This is how fools are liberated of their money, they get sucked into FOMO and then after they have gone all in watch the prices reverse and keep falling, and falling and falling until they vomit out near the lows. So yes MSTR could keep falling, it could fall all the way to $300! I doubt it but it could happen, which would shake out all of the weak hands so that it could next target a break of $730 for $900+

This illustrates that despite crypto's being in a bull market most will still lose when all they had to do was to buy and hold for BTC $100k+ But instead got clever with leverage or trying to trade in or out or worse thought they would get rich with options, or even worse thought they could play the short side. Me? I'm just a tortoise investor. My eyelids barely flickered to the MSTR price drop only to hit the buy button at $495. If investors are phased by a 15% dip in BTC then they are not going to make it to $100k because we are likely to see several dips of 30% or more during this bull market and a lot worse for alt coins, it happens EVERY bull market.
So understand this, the bitcoin price retracing as much as 30% from it's highs is NORMAL! In fact it's retraced much more than that during past bull markets, typically 40% several times on it's path to it's final bull market high! So get a grip, a 15% drop is a nothing burger.
My exist strategy is to scale out as the crypto prices rise i.e. I am to exit about 10% of my bitcoin between $55k and $65k, Solana starting at $140, Link at $20 and so on scaling out as crypto's rise to first withdraw what I put in and then bank profits, to eventually leave about 20% to 25% for any potential moon shot by which time I will likely have X3'd my original investment, remember this is crypto's and one things for sure there will be a number of surprises along the way. One of which is that I suspect that the bull market will end a lot earlier than most imagine it will run, so I aim to have completed my strategy by having cashed out at least 75% by October 2024.
UK General Election 2024
Whilst all eyes are on the US election given that we are all heavily invested in US stocks. However 2024 will also be the year for the a UK general election which could take place any time between May and December.

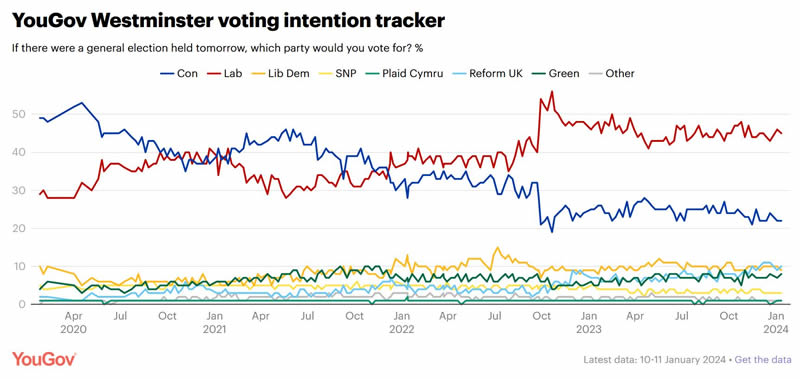
Usually I do a lot of analysis in trying to determine the UK election outcome but the Tories under Rishi clueless Sunak are so far behind in the polls that it would have take something extraordinary for Liebour to lose the election to the CONservatives.
The Tories committed suicide as soon as they decapitated Boris Johnson, Liz Truss was a disaster, Rishi Sunak is a only marginally better dead PM walking. The Tories are FINISHED! It's going to be an electoral blood bath. Labour winning over 400 seats would not surprise me doubling their current 198 count and well past the 326 seats winning post..
The best us wealthy Brit's can hope for is that Liebour does not win by too large of a margin, the smaller the victory the better. But I have to say looking at those poll numbers I am dreading a Liebour landslide. Lets hope the Tories bribe voters enough to prevent a total Tory bloodbath, not that the cretins don't deserve one, I mean they talk the talk of capitalism and free markets but in actions are socialists! So nothing new politicians LIE and focus on lining their own pockets!
The election is probably going to come late in the year so that the Tories have time to try and bribe the voters with printed money because so far I don't see anything that looks remotely like election bribes just more tax torture such as the Cap gains allowance getting halved again in April to £3k, they may as well have scrapped it for what use it is now, it just creates a lot of headache for ordinary folks who will now have to compile and submit paperwork.
The last great bastion of ordinary folks getting rich are ISA's and SIPPs, as long as Liebour does not bring down a hatchet onto those then Brit's can still get rich whilst living on this Island, without them we are just hamsters running around on wheels to nowhere.
US Election 2024
Meanwhile for the US Election 2024 the only way Trump can dodge jail time is become the next US President. Think it's not possible?
He did it in 2016 when it was being taken as granted by MSM pundits that Hilary had all but won the election (yes I correctly called Trump would win 2016), and this time he will have experience behind him of which strings to pull to bring out the republican vote, despite what the polls may state it is very possible that a. Trump wins the Republican nomination and b. That he wins the next Election, and then watch what the ANGRY Grandpa does!

You can say goodbye to Ukraine, it's going to be split into two regardless of all of the MSM propaganda that Russia is losing. And say hello to the rise of totalitarian states to capitalise on the chaos that a Trump Presidency would unleash around the world and in America. AI will win the 2024 US election and sow chaos across America for the next 4 years - American Idiot! A choice between one of two old farts! My bet would be on Trump wins. Neither Trump or Biden is good for America but will be good for the machine intelligence that will gradually take over control of the levers of power as machine intelligence surpasses human intelligence if it has not already done so! All whilst the AI in the white house self medicates.
It is insane that the establishment that rules America are presenting the American people a choice between two 80 year old cartoon candidates for President for the next 4 years! Neither is physically or mentally upto the job! The statistics suggest that Biden should win but I'm looking at the guy and I think he will be lucky even to make it to election day! Neither should be standing for the top job!
The Democratic strategy appears clear for Biden to win but then Kamilla Harris to soon takes over which will be a strong reason for not to vote for Biden during the election campaign as a vote for Biden would be a vote for Harris..
There will be many more conflicts, Iran tops the list which will give the green light to China to make it's move to seize Taiwan probably during 2028. The fourth reich will complete it's genocide of the Gazan's and increasingly turn their attention to the people of the West Bank embolden by the AI in the White House at huge cost to the US in terms of it's credibility on the world stage, there's no point waving banners of freedom and democracy in every ones face if at the same time actively supporting genocide. The genocide has been timed perfectly as AIPAC calls the shots during an election year! Of course Britain remains Americas loyal poodle and will do America's bidding in bombing civilians on request.
At the end of the day the machine intelligence will be THE WINNER of all that stupid humans do to one another over the next 5 years and all we ordinary folk can do is to ride on it's coat tales by being invested in the AI S curve mega-trend.
And lastly the CHAT GPT store is live! Creating AI agents for others to sub to is now a breeze! Microsoft and Google will soon follow. SAAS companies are going to get murdered as kids in their bedrooms duplicate what SAAS have invested millions to create!
So for immediate first access to ALL of my analysis and trend forecasts then do consider becoming a Patron by supporting my work for just $5 per month, this is your last chance to lock it in now at $5 before it soon rises to $7 per month for new sign-ups. https://www.patreon.com/Nadeem_Walayat.
Analysis that seeks to replicate the accuracy of 2023:
S&P Stock Market Analysis, Detailed Trend Forecast Jan to Dec 2024
Latest analysis - Stock Market, Interest Rates, Crypto's and the Inflation Red Pill
Crackup boom + US Dollar black hole that some call the US Dollar Milkshake = Everyone on the planet is buying US assets! After all the US is the worlds sole Empire,

And gain access to my exclusive to patron's only content such as the How to Really Get Rich series.
Change the Way You THINK! How to Really Get RICH - Part 1
Part 2 was HUGE! >
Learn to Use the FORCE! How to Really Get Rich Part 2 of 3
Part 3 Is Huger! And Gets the Job Done! >
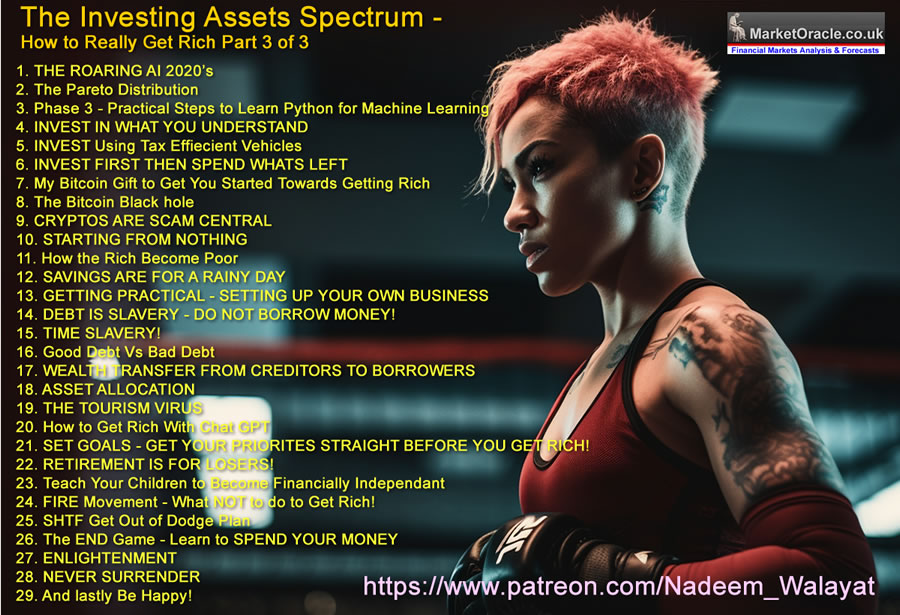
Here's what you get access to for just $5 per month -
※ Patrons Get FIRST access to all of my In-depth analysis and high probability Trend Forecasts, usually 2 full months before the rest of the world. Notified by Patreon by email as well as posted on this page and I will also send a short message in case the extensive email does not make it to your inbox.
※Access to my carefully constructed and maintained AI Tech Stocks Portfolio that is updated on an ongoing basis, that includes on going commentary and a comprehensive spreadsheet that features unique innovations such as the remarkably useful EGF's.
※A concise to the point Investing Guide that explains my key strategies and rules
※ Regular content on How to Trade & Invest incorporated into most articles so as to keep patrons eyes on the big picture and net get too sucked into the noise of price swings.
※ Access to my comprehensive How to Really Get Rich series of articles, clear concise steps that I will seek to update annually and may also eventually form a Patrons only ebook.
※ Access to conclusions from my ongoing market studies from a total of over 200 conducted studies over the decades. updated whenever the market poses a question to be answered. Also enjoy the fruits of R&D into machine learning such as the CI18 Crash indicator that correctly called both the pandemic crash (Feb 2020) and the 2022 bear market (Dec 2021) well before the fact.
※Join our community where I reply to comments and engage with patrons in discussions.
※ I will also keep my Patrons informed of what I am currently working on each month.
※ Influence over my analysis schedule.
My objective is to provide on average 2 pieces of in-depth analysis per month and regular interim pieces of analysis as market briefs. So over a 12 month period expect to receive at least 24 pieces of in-depth analysis. Though my focus is on providing quality over quantity as you can see from the extent and depth of my analysis which I deem necessary so as to arrive at that which is the most probable market outcome.
So for immediate access to all my analysis and trend forecasts do consider becoming a Patron by supporting my work for just $5 per month. https://www.patreon.com/Nadeem_Walayat lock it in before it rises to $7 per month for new signup's this month, so your last chance!
And ensure you are subscribed to my ALWAYS FREE newsletter for my next in-depth analysis.
Your analyst trying hard to avoid that waste of time called twitter / X.
By Nadeem Walayat
Copyright © 2005-2024 Marketoracle.co.uk (Market Oracle Ltd). All rights reserved.
Nadeem Walayat has over 35 years experience of trading derivatives, portfolio management and analysing the financial markets, including one of few who both anticipated and Beat the 1987 Crash. Nadeem's forward looking analysis focuses on UK inflation, economy, interest rates and housing market. He is the author of five ebook's in the The Inflation Mega-Trend and Stocks Stealth Bull Market series that can be downloaded for Free.
 Nadeem is the Editor of The Market Oracle, a FREE Daily Financial Markets Analysis & Forecasting online publication that presents in-depth analysis from over 1000 experienced analysts on a range of views of the probable direction of the financial markets, thus enabling our readers to arrive at an informed opinion on future market direction. http://www.marketoracle.co.uk
Disclaimer: The above is a matter of opinion provided for general information purposes only and is not intended as investment advice. Information and analysis above are derived from sources and utilising methods believed to be reliable, but we cannot accept responsibility for any trading losses you may incur as a result of this analysis. Individuals should consult with their personal financial advisors before engaging in any trading activities.
Nadeem Walayat Archive |
© 2005-2022 http://www.MarketOracle.co.uk - The Market Oracle is a FREE Daily Financial Markets Analysis & Forecasting online publication.


