INFLATION and the Stock Market Trend
Stock-Markets / Stock Markets 2024 Mar 01, 2024 - 05:45 AM GMTBy: Nadeem_Walayat
Dear Reader
The crypto bull market is under way! For just $5 bucks you could have accumulated Bitcoin at $27k instead of at the current price of $62k. Still not to late to captialise on the great crypto bull market of 2024! Last Chance to Get on Board the Bitcoin Crypto Gravy Train - Choo Choo!
INFLATION and the Stock Market Trend
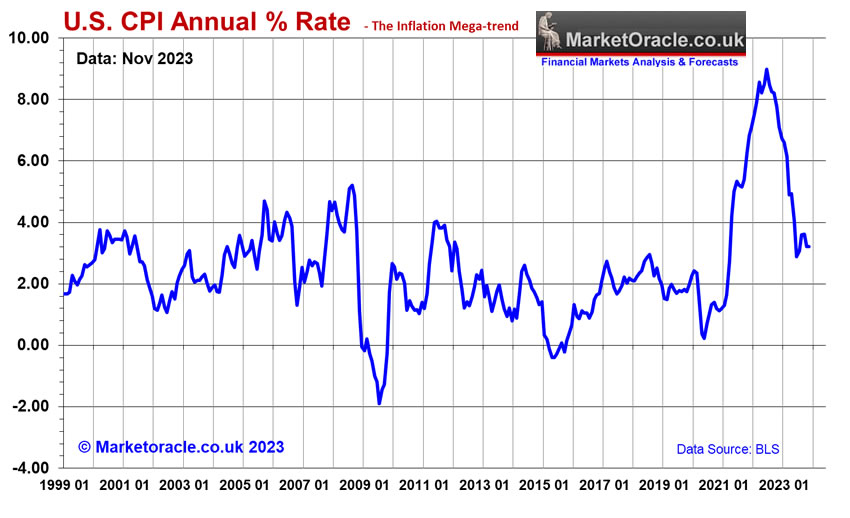
US CP LIE Inflation has been moderating, largely due to the base effect as surge in inflation a year ago leaves the annual inflation indices thus giving the illusion of inflation being under control hence the focus of econofools. Whilst there is also real world impact of weak European and Chinese economies, that and the effect of base rate rises feeding through should continue to put downward pressure on CPI until at least release of Feb data in March 2024, after which inflation could tick higher to back over 3% for the rest of the year.
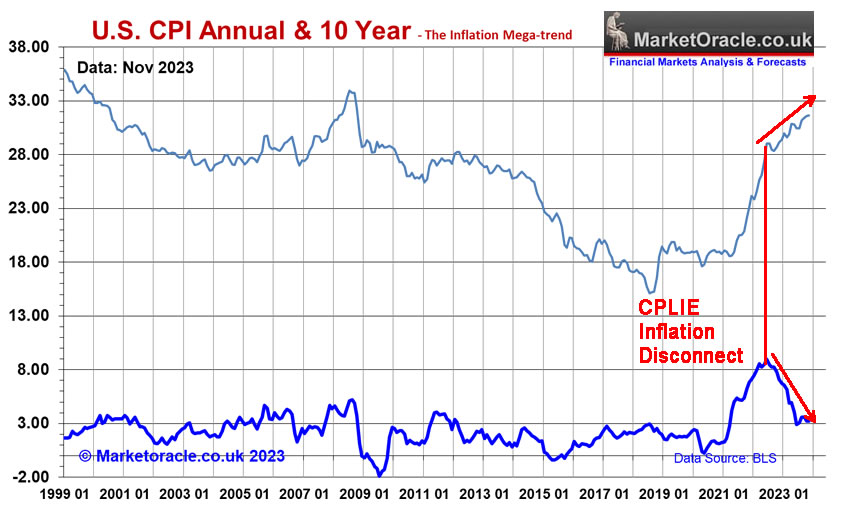
However the annual indices are a smoke and mirrors con job to fool the masses into believing that inflation is now back under control, instead the US and the rest of the world continues to face a decade of high inflation as the 10 year inflation graph illustrates that the Inflation pain that most people experience continues to worsen with each passing month that is in complete disconnect to the economic propaganda that MSM attempts to ram down peoples throats that the inflation crisis is over. No it's NOT, it is STILL getting worse with each passing month! And will likely continue to do so well into 2024 before it starts to moderate as the economy weakness due to the delayed impact of rate hikes.
So what does Inflation say for the stock market?
Lower headline and core inflation rates should put downwards pressure on yields and upwards pressure on stocks into at least March 2024 that should extend into April. That and the underlying hidden to most inflation trend will continue to inflate revenues and earnings for most stocks.
The bottom line is that Inflation is FRAUD perpetuated on the people by the criminal entity that calls itself the Government. They print and spend the money first and then the workers get it after prices have gone up. Then the crime syndicate TAXES you on the GAIN in INFLATED ASSET PRICES! AND TAXES you on the INTEREST that FAILS to keep pace with inflation. The only way out of the Inflation fraud matrix is to invest in assets held in tax free wrappers that BEAT inflation, which takes hard work and where you lucky guys and gals have me to do the heavy lifting for you. Though it is always wise to educate yourselves along the way to maximise returns as the more work one puts in the more one will get out.
This is what Inflation has done for stock prices -
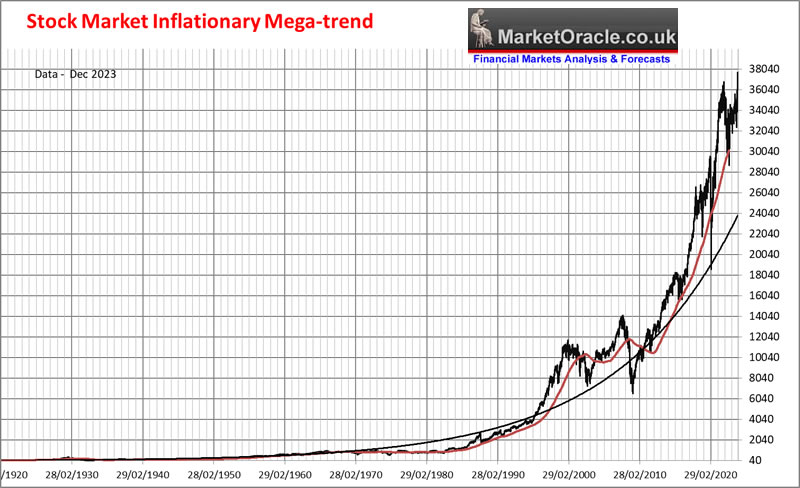
Which illustrates the extent of the insanity of the deflation is always coming stocks perma bears, they are fighting against the Inflationary force that they just do not understand!
US Unemployment is a Fake Statistic
Whilst everyone focuses on the unemployment rate as a gauge for economic activity, however the statistic has been engineered to the extent to become meaningless as shadow stats illustrates.
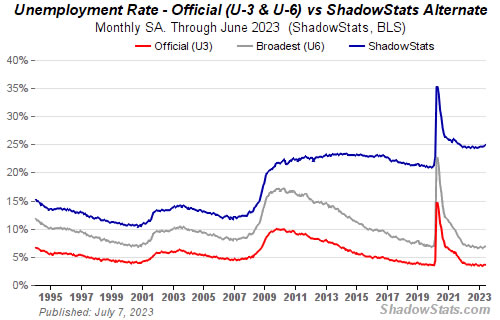
And the situation is even worse or better depending on ones perspective, in that the average work week has been continuously shrinking following the start of the age of the microprocessor, i.e. tech has been acting to reduce the average number of hours worked through both booms and busts, that AI looks set to accelerate all the way towards a Universal Basic Income.
What does this mean?
It means many of the statistics that the academics follow are skewed or trending in a particular direction over time, so economists are misreading when they state for today's worker as working LESS on average then a worker of 20 years go. So saying that AI is going to deliver a lower work week is not something in the distant future, it has already been happening since the birth of the microprocessor and this trend will continue.
Implications for stocks
Take economic stats such as the unemployment rate, non farm payrolls and such with a pinch of salt unless they have been normalised for the impact of tech, as they give a misleading picture, which is why economists keep getting wrong footed in that a. they forget their statistics are fake, and b. That there is a technological AI megatrend in motion that impacts on all areas of the economy. This is the problem with academic economists they will fail to peel enough layers away to get to uncover what is actually going on and thus tend to miss the big picture.
S&P Real Earnings Yield
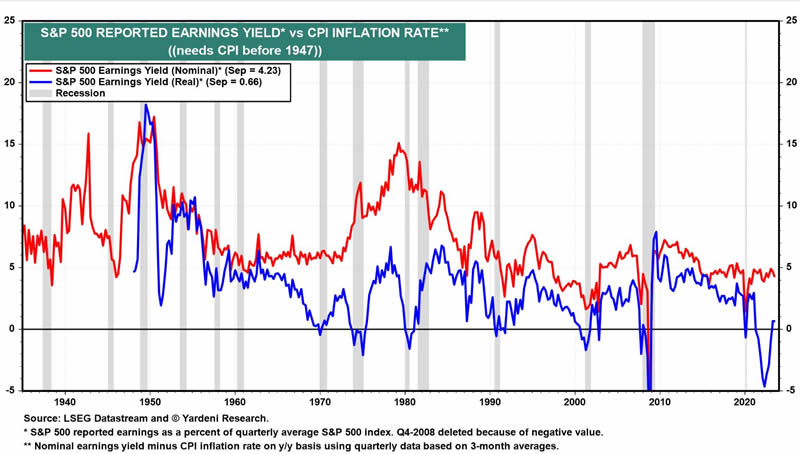
Here's another indicator to pile on top of a mountain of indicators that I have been covering over the years that spiked lower below 0 into 2022 before bouncing. during 2023. Of note is the fact that every spike below zero is accompanied by a recession. So where's the recession? Answer it HAPPENED during 2022! It's just that the econofools had talked themselves out of recognising the fact that a recession had taken place.
What the chart suggests is to continue to expect higher stock prices for 2024 and several more years beyond.
S&P EGF EPS Growth
Earnings growth as measured by the EGF metrics (spreadsheet), have next quarter at +4%, and 1 year forward at +10%, which converts in a forward PE of 20 vs current 22. This puts the S&P at 49% of it's PE range falling to 17% by end of 2024 which means that if the S&P rises by 10% by the end of 2024 then it will likely be on the same valuation as where it sits today i.e,. at about 50% of it's P/E range, that also offers scope for some P/E expansion. Thus the S&P should rise by at least 10% during 2024, which on 4770 suggests that the S&P should trade to at least 5247 during late 2024 and likely end the year well above 5200.
When WIll the Fed Pivot
The current Fed Funds rate is 5.25% with he market expectations for the cuts to commence March 2023, though the market has been wrong for the whole of 2023 when Fed rate cuts were always seen as starting some 6 months into the future! In reality it does not matter when the Fed cuts rates because the Fed FOLLOWS the market rates not sets them. And the market rates as evidenced by bond yields has been falling for the past few months.
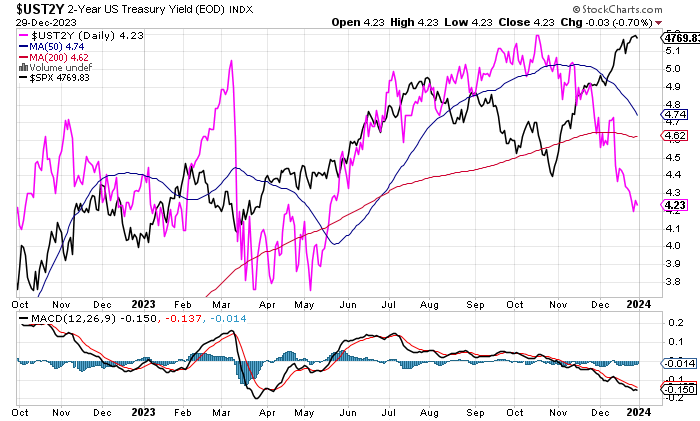
(Charts courtesy of stockcharts.com)
So whilst there has been no movement on the short end, the long end has seen a huge moderation in yields with the 10 year falling from 4.9% 3 months ago to 3.9% today which illustrates the point that the Fed FOLLOWS the market rather than leads the market as most financial instruments such as mortgages base their rates on the longer end of the yield curve and thus have effectively experienced a 1% cut in their interest rate.
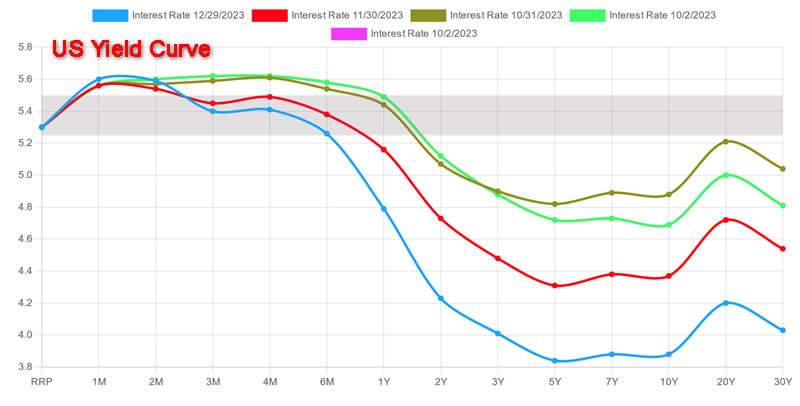
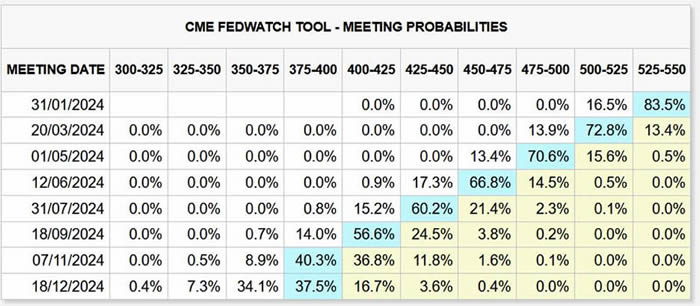
So even though what the Fed does is a nothing burger, i.e. follows the market rather than leads, nevertheless the lemmings that are market traders and fund managers tend to react to the Fed to an extent that it can deliver short-term volatility especially if taking place at times of expected market Junctures such as the scenario that the current upswing should terminate during January which could be timed to take place with the 31st Jan Fed decision, though in respect of which there is an 83% probability for no change in the Fed funds rate.
However by March with CPI under 3% the Fed should start to reduce the Fed funds rate to track falling inflation given by then the gap will be over 1.5% that could see the rate drop by 0.75% by the time of the June 12th meeting.
What does this mean for the stock market.
It does imply economic weakness because as the Fed keeps reminding us it is not going to cut the fed funds rate anytime soon, so there is economic pain for the consumer on the short-tend, but rates on the longer will continue to improve depending on how tight the credit markets are, it's basically a balancing act between trying to keep a lid on inflation so depress the economy but not to the extent to trigger inflation as that would make the US debt to GDP state even worse.
The Fed is trying to engineer a weakly growing economy engineered to depress long-rates for the treasury to issue bonds at as low a coupon as possible below 4%.
A balancing act for the economy and the stock market which implies volatility with an upwards bias, i.e. the stock market should end 2024 higher then where it began, 2023 saw a 24% advance, it's not going to be 24% because this is balancing act that most are blind to i.e. everyone is waiting for the inversion to end and then rates to be cut, which as things look neither of which may happen much during most of 2024.
Stocks and Inverted Yield Curve
Yield curve now inverted for 21 months so where's the recession? An inverted yield curve is supposed to predict an recession, however as I pointed out months ago for why I was accumulating long-bonds is that the US Treasury NEEDS LOWER long-term interest rates for it's flood of debt issuance during 2024, it does not want to pay 5% interest on this debt that continues to inflate the debt interest spiral. So the Fed will engineer LOWER long term yields whilst maintaining higher short-term rates so as to continue to suppress INFLATION! Which is what has come to pass, long rates are now 1% lower whilst the Fed fund rate remains at 5.25%.
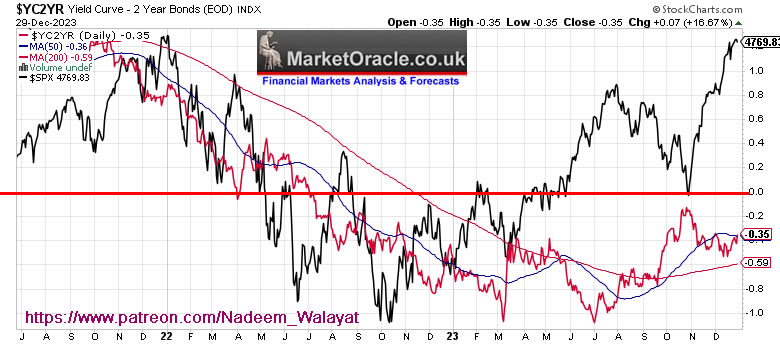
The yield curve inversion which has accurately called every modern recession about 6-18 months after the inversion this time is a nothing burger! It works until it doesn't! Failure to recognise this fact is why so many are still sat on the sidelines watching stock prices soar higher as they wait for their recession crash to 3200 to buy.
This article is an excerpt from my in-depth analysis and concluding S&P detailed trend forecast for 2024 - S&P Stock Market Analysis, Detailed Trend Forecast Jan to Dec 2024 has first been made available to patrons who support my So for immediate first access to ALL of my analysis and trend forecasts then do consider becoming a Patron by supporting my work for just $5 per month, this is your last chance to lock it in now at $5 before it soon rises to $7 per month for new sign-ups. https://www.patreon.com/Nadeem_Walayat.
Analysis that seeks to replicate the accuracy of 2023:
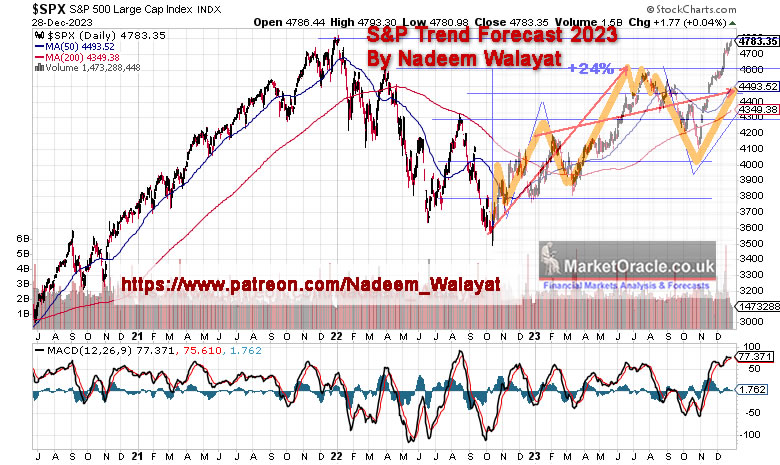
S&P Stock Market Analysis, Detailed Trend Forecast Jan to Dec 2024
CONTENTS
Investing in the Stock Market is Like Boxing With Mike Tyson
Keep Calm and Carry on Buying Quantum AI Tech Stocks
Synthetic Intelligence
The Roaring AI 2020's
Stock Market 2023 Trend Forecast Review
STOCK MARKET DISCOUNTING EVENTS BIG PICTURE
Major Market lows by Calendar Month
US Exponential Budget Deficit
QE4EVER
US Stock Market Addicted to Deficit Spending
INFLATION and the Stock Market Trend
US Unemployment is a Fake Statistic
S&P Real Earnings Yield
S&P EGF EPS Growth
When WIll the Fed Pivot
Stocks and Inverted Yield Curve
The Bond Trade and Interest Rates
US Dollar Trend 2024
US Recession Already Happened in 2022!
US Presidential Election Cycle and Recessions
Margin Debt
Stock Market Breadth
Stock Market Investor Sentiment
Bitcoin S&P Pattern
SP Long-term Trend Analysis
Dow Annual Percent Change
Stock Market Volatility (VIX)
S&P SEASONAL ANALYSIS
Correlating Seasonal Swings
Presidential Election Cycle Seasonal
Best Time of Year to Invest in Stocks
Formulating a Stock Market Trend Forecast
S&P Stock Market Trend Forecast Jan to Dec 2024
Quantum AI Tech Stocks Portfolio
Primary AI Stocks
AI - Secondary Stocks
TESLA
Latest analysis - How to Profit from the Global Warming ClImate Change Mega Death Trend
I'm a climate change denier! I deny the right of climate change to prevent me from getting richer! Large swathes of planet may become a scorched earth but.....

And gain access to my exclusive to patron's only content such as the How to Really Get Rich series.
Change the Way You THINK! How to Really Get RICH - Part 1
Part 2 was HUGE! >
Learn to Use the FORCE! How to Really Get Rich Part 2 of 3
Part 3 Is Huger! And Gets the Job Done! >
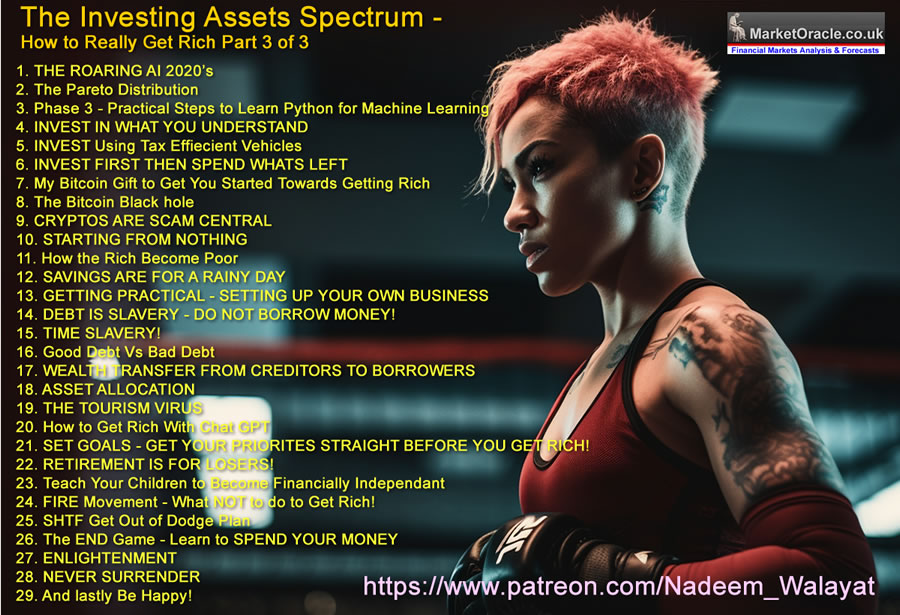
Here's what you get access to for just $5 per month -
※ Patrons Get FIRST access to all of my In-depth analysis and high probability Trend Forecasts, usually 2 full months before the rest of the world. Notified by Patreon by email as well as posted on this page and I will also send a short message in case the extensive email does not make it to your inbox.
※Access to my carefully constructed and maintained AI Tech Stocks Portfolio that is updated on an ongoing basis, that includes on going commentary and a comprehensive spreadsheet that features unique innovations such as the remarkably useful EGF's.
※A concise to the point Investing Guide that explains my key strategies and rules
※ Regular content on How to Trade & Invest incorporated into most articles so as to keep patrons eyes on the big picture and net get too sucked into the noise of price swings.
※ Access to my comprehensive How to Really Get Rich series of articles, clear concise steps that I will seek to update annually and may also eventually form a Patrons only ebook.
※ Access to conclusions from my ongoing market studies from a total of over 200 conducted studies over the decades. updated whenever the market poses a question to be answered. Also enjoy the fruits of R&D into machine learning such as the CI18 Crash indicator that correctly called both the pandemic crash (Feb 2020) and the 2022 bear market (Dec 2021) well before the fact.
※Join our community where I reply to comments and engage with patrons in discussions.
※ I will also keep my Patrons informed of what I am currently working on each month.
※ Influence over my analysis schedule.
My objective is to provide on average 2 pieces of in-depth analysis per month and regular interim pieces of analysis as market briefs. So over a 12 month period expect to receive at least 24 pieces of in-depth analysis. Though my focus is on providing quality over quantity as you can see from the extent and depth of my analysis which I deem necessary so as to arrive at that which is the most probable market outcome.
So for immediate access to all my analysis and trend forecasts do consider becoming a Patron by supporting my work for just $5 per month. https://www.patreon.com/Nadeem_Walayat lock it in before it rises to $7 per month for new signup's this month, so your last chance!
And ensure you are subscribed to my ALWAYS FREE newsletter for my next in-depth analysis.
Your cryptos bull market locked and loaded analyst.
By Nadeem Walayat
Copyright © 2005-2023 Marketoracle.co.uk (Market Oracle Ltd). All rights reserved.
Nadeem Walayat has over 35 years experience of trading derivatives, portfolio management and analysing the financial markets, including one of few who both anticipated and Beat the 1987 Crash. Nadeem's forward looking analysis focuses on UK inflation, economy, interest rates and housing market. He is the author of five ebook's in the The Inflation Mega-Trend and Stocks Stealth Bull Market series that can be downloaded for Free.
 Nadeem is the Editor of The Market Oracle, a FREE Daily Financial Markets Analysis & Forecasting online publication that presents in-depth analysis from over 1000 experienced analysts on a range of views of the probable direction of the financial markets, thus enabling our readers to arrive at an informed opinion on future market direction. http://www.marketoracle.co.uk
Disclaimer: The above is a matter of opinion provided for general information purposes only and is not intended as investment advice. Information and analysis above are derived from sources and utilising methods believed to be reliable, but we cannot accept responsibility for any trading losses you may incur as a result of this analysis. Individuals should consult with their personal financial advisors before engaging in any trading activities.
Nadeem Walayat Archive |
© 2005-2022 http://www.MarketOracle.co.uk - The Market Oracle is a FREE Daily Financial Markets Analysis & Forecasting online publication.


