Banking Crisis is Stocks Bull Market Buying Opportunity
Stock-Markets / Stock Market 2023 Apr 29, 2023 - 08:30 PM GMTBy: Nadeem_Walayat
It's CPI Tuesday! We usually get a fake out move going into CPI then a reversal soon after which given that the market has been falling since the 6th of March into CPI data release then we should be setting up for a reversal higher some time after release of CP LIE which chimes with my end of the correction expectations given that both primary (3900) and secondary (3820) correction targets have been fulfilled.
Last month my CPI forecast table suggested to expect 6.28% vs actual of 6.4%. For February the table expects a sharp drop to 5.66% vs consensus of 6%, actual is probably going to be somewhere between 5.66% and 6%, so a net positive CPI data release should give weight to the next Fed rate hike being 0,25% instead of 0.5%, with the really big CPI drop coming on April's data release after which I expect inflation will become more sticky.
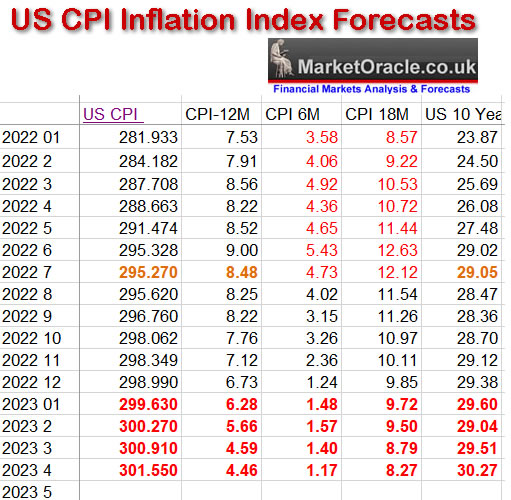
However, then we have the impact of the SVB panic bank run that has resulted in tightening of credit markets and thus is deflationary to some degree, For more on the inflation mega-trend see ny previous article - https://www.patreon.com/posts/stock-market-to-78628081
The Fed once more BAILED OUT the banking crime syndicate to the extent that they can now go and gamble to their hearts content knowing that should their derivatives bets go belie up then the Fed and other central banks will step in to make depositors whole again. Okay, it's a little more complicated than that involving banks parking excess deposits in long dated US treasuries as they chased yields only to be hit by the Fed inflation curve ball rate hike cycle which means that if they are forced to SELL bonds to any significant extent then they are ALL BANKRUPT! Even the biggest of big banks! Simply they need to hold bonds to maturity to avoid booking the loss..
This article is an excerpt from SVB Collapse Buying Opportunity Counting Down to Resumption of Stocks Bull Market that was first made available to patrons who support my work.So for immediate first access to ALL of my analysis and trend forecasts then do consider becoming a Patron by supporting my work for just $5 per month. https://www.patreon.com/Nadeem_Walayat.
And gain access to the following most recent analysis -
- Stock Market Counting Down to Apple Earnings Trend Acceleration
- Stock Market S&P Swings Analysis Going into Earnings Season
US Bond Yields
That was one hell off a drop in the 2 year yield yesterday, went straight from 5% to 4%. Now US rates are on par with where they were when the S&P was trading at 4200, of course it's not as simple as that, the rate fell in response to the Fed bailout of the banking crime syndicate. Still this should be positive for stocks.
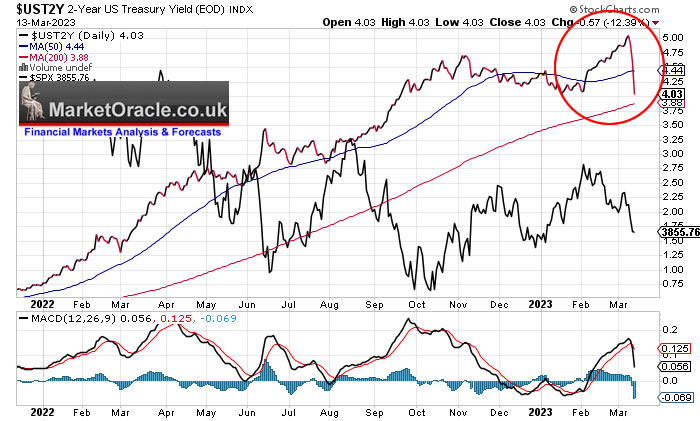
(Charts courtesy of stockcharts.com)
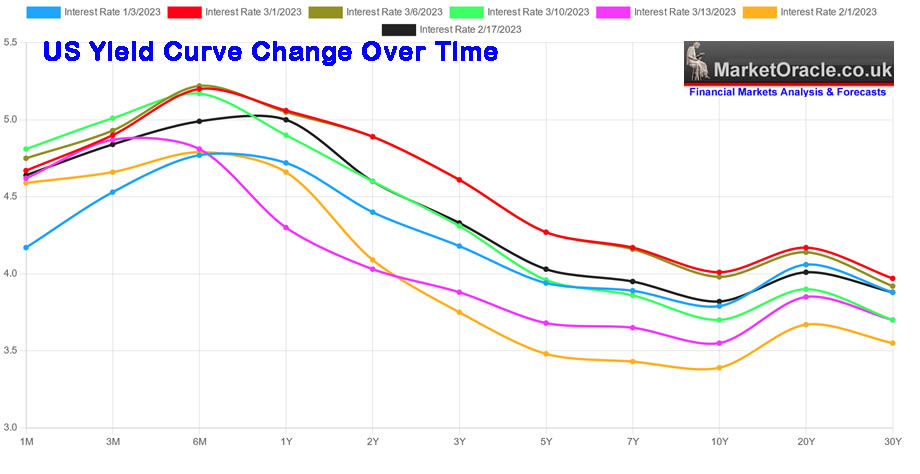
This chart shows how the US yield curve has evolved since the start of the year where yesterday (pink) yields fell more sharply at the shorter end than the longer end resulting in a narrowing of the inversion. between the 2 year and the 10 year. For a clearer [picture focus on the red (12th March) vs the pink (13th March) curves to see the magnitude of the change.
What does this mean?
It means the market is not only discounting no further rate hikes but also several rate CUTs this year, Is that going to happen? I doubt it! I still think the Fed will raise rates until the Fed funds rate exceeds CPI, so maybe 1 or 2 more 0.25% rate hikes.
So interest rates have taken a nose bleed dive as the market correctly discounts the fact that what the Fed fears most is a financial crisis that could easily spiral out of control and thus seek to do their utmost to prevent a repeat of the near death experience of 2008. Which is another reason why all those bandying around charts of 2008 expecting a rerun during first 2022 and now 2023 are going to be disappointed. The Fed of pre Lehman's collapse no longer exists, the Fed since is determined to never witness a repeat of 2008 and hence the weekends shock and awe announcement that caught the bears by surprise, we'll what did they think the Fed was going to do? Let 2008 repeat?
Last 2 DAILY Briefs Recap
Stock Market Brief - 10th March 2023 (10.30am UK)
S&P 3916 - Bounced to above 4000 and then dumped towards 3900, .as expected broke the 3920 last low. trading down to 3907 and below 3900 after hours, in fact the low as of a few hours ago was 3883! That's my low end target for the 3882 to 3900 range! So fulfilled primary target, secondary being 3790-3820, trend to 3900 triggered a number of small buys in the likes of IBM, MGNI, IIPR, Redfin, GPN, Qualcom, MPR, Inmode, Amazon, Pfizer, JNJ. Whilst others await lower prices.
What;'s next is not easy AHEAD of Non farm payrolls data release at 1.30pm UK Time, it's a bit like flying a plane in a cloud and not knowing if there is a mountain ahead or not. Financials are under pressure so that is a downwards pull on the stock indices which suggests 3820 is more probable than not given that the likes of Tesla amongst others have reversed lower, with Tesla at $173 on the verge of entering it's accumulation zone of $164 to $142. Another plus is that sterling has not fallen much (1.196) which makes for easier US stock buys for UK investors compared to October 2022's sterling blood bath.
So we could see a fake bounce on NFP before the dump towards 3790-3820, how high could it bounce? We'll it's a straight line drop from the 3975-4000 zone to the after hours low of 3883, so it could bounce all the way back into that zone before dumping towards 3800, .It is not easy ahead of NFP hence why I am positioned to buy the dip.
Actual - S&P rallied on NFP to 3940 before dumping to a low of 3840.
Stock Market Brief - 13th March 2023 (10.30am UK)
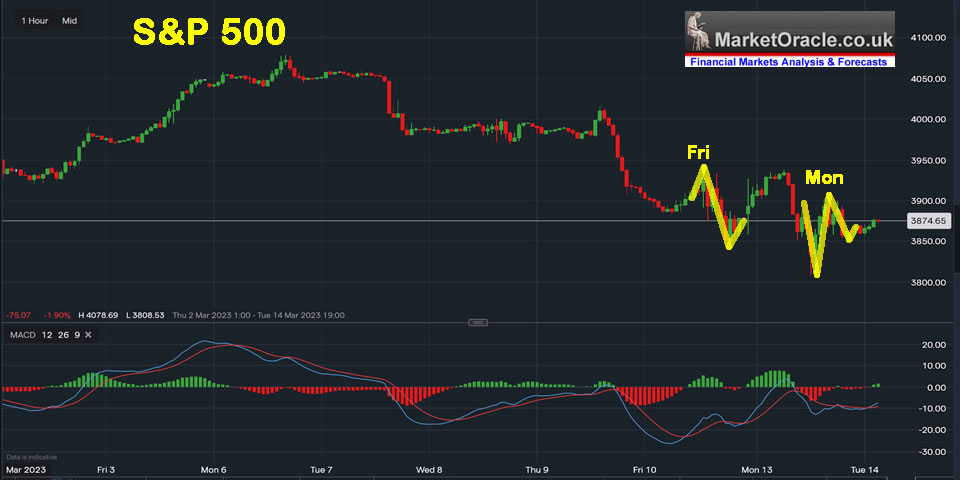
S&P 3860 - Given the amount of volatility it is a tough call to make but I very much doubt 3840 is THE LOW, so the S&P should trade to below 3820, nudge below 3800 before confounding the herd by embarking on an inexplicable rally that normally resolves in retest for a higher low to set the scene for the main rally into late April / early May. So a dump to below 3800 will bring more target stocks well into their buying ranges. I'll expand in an article in some 24 hours time ahead of CPI.
Actual - S&P reversed the bailout pre market rally from 3938 tumbling to an early low of 3809 before trending higher to settle at 3852.
I'll continue with the short-term briefs at a lower frequency of 2 per week, one at the weekend and one during the week, else that is all I will end up having time to send each month.
Current Trend
The S&P remains in a downtrend i.e. lower highs and lows and thus continues to target a break of 3800 on the short-term basis. In terms of swings the correction could extend to as deep as 3745 though I doubt it will go that low, more likely will bounce around between 3890 and 3780 for a few days.
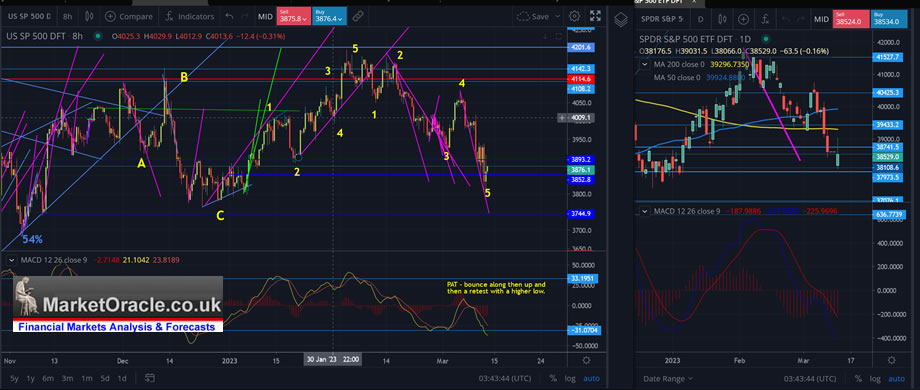
As for what us likely to transpire beyond this then in steps our trusty road map that dates back to my in-depth analysis of October 2022.
- Stocks Bear Market Max PAIN - Trend Forecast Analysis to Dec 2023 - Part1
- Stock Market Analysis and Trend Forecast Oct 2022 to Dec 2023
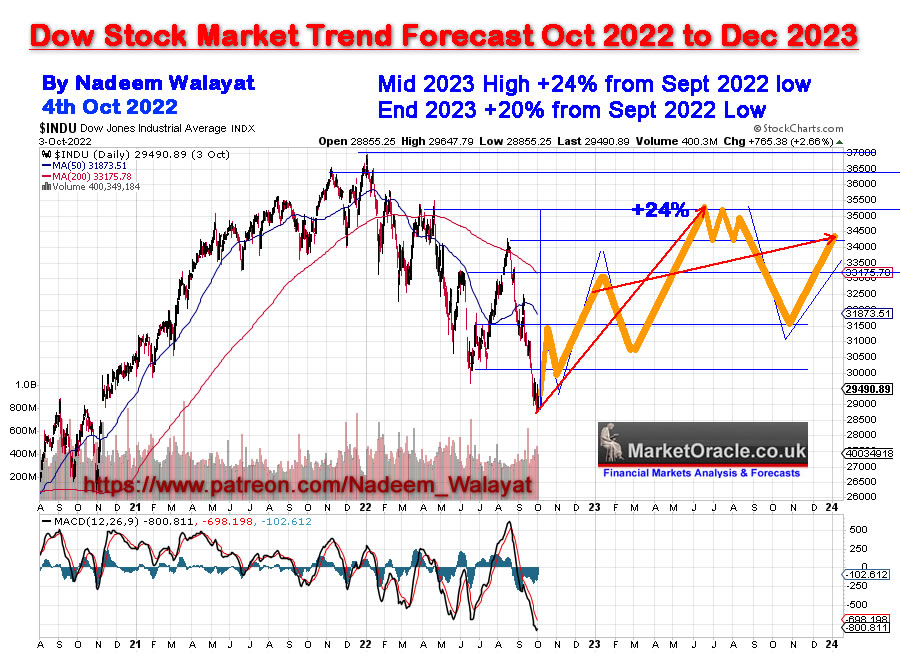
Note this is a rough road map of how I expect the stock markets trend to play out during 2023, the chances that the stock market 5 months on is going to for instance bottom early March was pretty slim, instead the road map shows the direction of travel coupled with current analysis on subsequent price action. For instance the road map paints a picture for the stock market correction ending during March before entering a powerful bull trend into Mid Summer, that current price action acts to test and fine tune..
The stock market has fulfilled it's primary 3900 and secondary 3820 objectives for this correction that began at the start of February so should be carving out a bottoming price pattern over the coming days to set the scene for the bull run to resume that more likely than not will include a retest for a higher low as is the observed MACD pattern suggests to expect. Thus the correction both in terms of time and price and the road map should be on it's last legs.
Other signs for a resumption of the bull run can be seem in the fact that so far maximum doom and gloom has failed to deliver any of the panic selling that many had convinced themselves was imminent. It does not get more doom and gloom than a run on the banks, despite which the S&P is little changed on where it was before SVB blew up.
Therefore the most probable outcome is for the market to soon enter into it's next uptrend that will take the S&P to a new bull market high i.e. to beyond the last high of 4195, and likely beyond 4300, leaving many to scratch their heads as to what the hell is going on?
In conclusion I am expecting the following trend pattern over the next 4 to 5 weeks, i.e. basing now for an advance into late April enclosing a trend that see's a rally to above 4000 followed by a retest for a higher low and then it's off to the races to well above the last high of 4195.
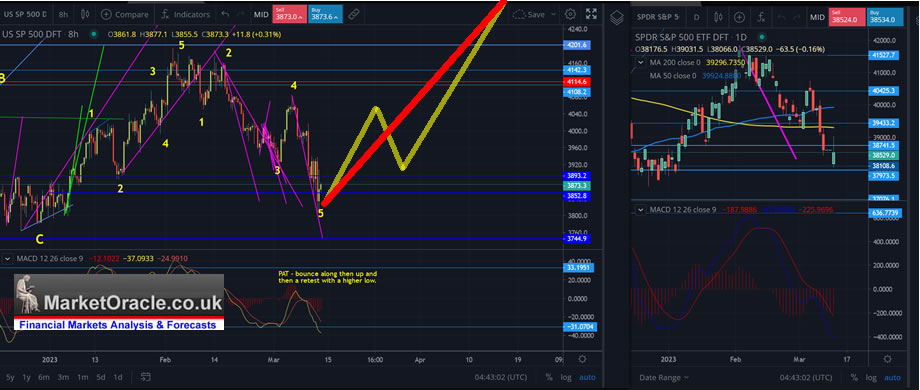
Whilst my stock market big picture is for a bullish 2023 followed by a bearish 2024, baring in mind the bull run is probably going to peak during summer as per my original trend forecast road map.
AI Stocks Portfolio
Despite the stock market falling as expected many target stocks have stubbornly resisted correcting to any significant degree which is probably due to flight to safety to AI tech stocks, the likes of Nvidia, AVGO, TSMC whilst others appear to have fully embraced the panic and fallen hard such as GPN where I was already over invested to 128% going into the correction but now after the free fall below $100 stand at 150% invested, Further across the board mostly small buys have lifted my exposure to 87.8% invested 12.2% cash accumulating into Google, Amazon, Qualcom, Micron, IBM, JNJ Pfizer, and higher risk stocks - GPN, KLAC, CARA, ULH. amongst others.
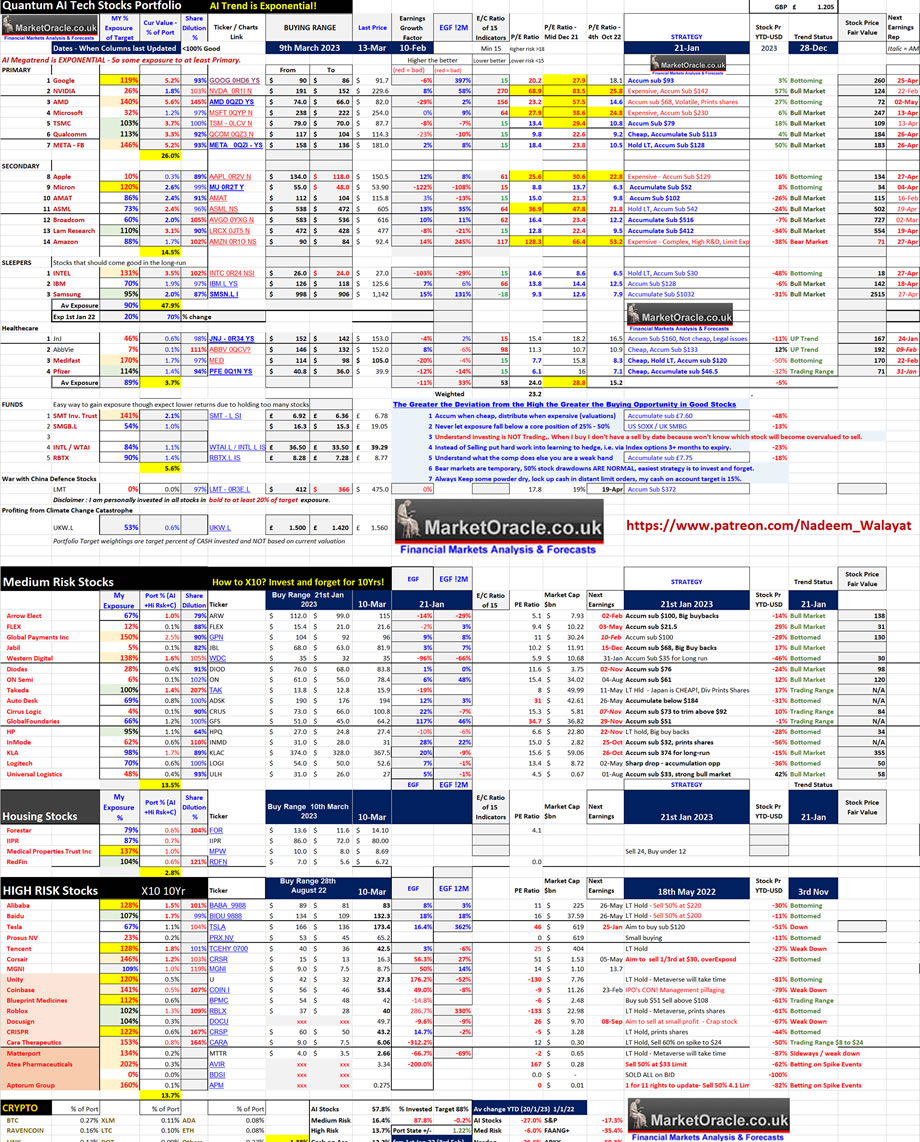
Table Big Image - https://www.marketoracle.co.uk/images/2023/Mar/AI-stocks-13-3-big.jpg
Google Sheet https://docs.google.com/spreadsheets/d/1ujy3c_NzvDfUAuRx5QY5lqgkpfmos2rWvp09EtClmoc/edit?usp=sharing
Stocks in their Buying Ranges That I have Been Accumulating
QCOM - $114 - $117 to $104
Micron $53.0 = $55 to $48
IBM $125 - $126 - $118
JNJ - $153 - $152 to $142
Pfizer $39.9 - $40.8 to $36
CARA $5.83 - Catching a falling knife on earnings miss.
KLA $364 - $374 to $328
INMODE - $31 - $31 to $29
ULH $27 - $31 to $26
WDC $35 - $35 to $32
GPN $96 - $104 - $92
MGNI - $8.7 - $9 to $7.5
Stocks Near their Buying Ranges that I have been nibbling on.
Google - $91.7 - $90 to $86
AMAT $115 - $112 - $104
ASML - $605 - $572 to $538
AVGO - $616 - $583 to $536
LRCX - $477 - $472 to $432
Amazon $92.4 - $90 to $84
Intel $27 - $26 to $24
ADSK - $197 - $190 - $176
ARW $115 - $112 to $99
Target Stocks Pending Deeper Draw downs
Nvidia $229.6 - $192 to $152
Microsoft $254 - $238 to $222
META $181 - $158 - $136
Tesla $174.8 - $166 to $136
USDC investor shells out $2M to receive $0.05 USDT trying to evade stable coin crash
The danger of trading at the market instead of setting a limit order - This guy panic sold $2 million of USDC for USDT and got 5 cents of USDT in exchange due to failure to set a slippage limit, as the bot routed his order for maximum profit, illustrates that the crypto exchanges are put to steal your funds. However such slippage is not just limited to crypto's it can happen to small and medium cap stocks!
https://cointelegraph.com/news/usdc-investor-shells-out-2m-to-receive-0-05-usdt-trying-to-evade-crash
This is why one scales in and out of positions because sometimes the broker will screw you! Etorro recently screwed me out of $50 bucks on an ARW short position, the stock gapped DOWN on the open but I sill got stopped out of my short, how? the spread magically extended upwards to hunt stop loss on the GAP DOWN open! Becareful out there especially when using stops because the likes of Etorro WILL stop you out!
Your analyst once more putting his neck on the chopping block ahead of CP LIE.
This article is an excerpt from SVB Collapse Buying Opportunity Counting Down to Resumption of Stocks Bull Market that was first made available to patrons who support my work.So for immediate first access to ALL of my analysis and trend forecasts then do consider becoming a Patron by supporting my work for just $5 per month. https://www.patreon.com/Nadeem_Walayat.
Immediate first access to ahead of the curve analysis as my extensive analysis of the stock market illustrates (Stocks Bear Market Max PAIN - Trend Forecast Analysis to Dec 2023 - Part1), that continues on in the comments section of each posted article, all for just 5 bucks per month which is nothing, if you can't afford 5 bucks for month then what you doing reading this article, 5 bucks is nothing, if someone did what I am doing then I would gladly pay 5 bucks for it! Signup for 1 month for a taste of the depth of analysis that cannot be beat by those charging $100+ per month! I am too cheap! I am keeping my analysis accessible to all, those willing to learn because where investing is concerned the sooner one gets going the better as portfolios compound over time, $5 month is nothing for what you get access to so at least give it a try, read the comments, see the depth of analysis, you won't be sorry because i do do my best by my patrons, go the extra mile.

And gain access to the following most recent analysis -
- Stock Market Counting Down to Apple Earnings Trend Acceleration
- Stock Market S&P Swings Analysis Going into Earnings Season
- SVB Collapse Buying Opportunity Counting Down to Resumption of Stocks Bull Market
- Stock Market Counting Down to Pump and Dump US CPI LIE Inflation Data Release
- Stock Market Completes Phase Transition, US Real Estate Stocks - Housing Market Part1
- S&P500, Gold, Silver and Crypto's Trend Forecasts 2023
So for immediate first access to to all of my analysis and trend forecasts then do consider becoming a Patron by supporting my work for just $5 per month. https://www.patreon.com/Nadeem_Walayat.
My Main Analysis Schedule:
- US House Prices Trend Forecast - 50%
- Global Housing / Investing Markets - 50%
- US Dollar / British Pound Trend Forecasts - 0%
- High Risk Stocks Update - Health / Biotech Focus - 0%
- State of the Crypto Markets
- Gold and Silver Analysis - 0%
- How to Get Rich - 85%

Again for immediate access to all my work do consider becoming a Patron by supporting my work for just $5 per month. https://www.patreon.com/Nadeem_Walayat.
And ensure you are subscribed to my ALWAYS FREE newsletter for my next in-depth analysis.
Your Preparing to SELL the Rip analyst.
By Nadeem Walayat
Copyright © 2005-2023 Marketoracle.co.uk (Market Oracle Ltd). All rights reserved.
Nadeem Walayat has over 30 years experience of trading derivatives, portfolio management and analysing the financial markets, including one of few who both anticipated and Beat the 1987 Crash. Nadeem's forward looking analysis focuses on UK inflation, economy, interest rates and housing market. He is the author of five ebook's in the The Inflation Mega-Trend and Stocks Stealth Bull Market series that can be downloaded for Free.
 Nadeem is the Editor of The Market Oracle, a FREE Daily Financial Markets Analysis & Forecasting online publication that presents in-depth analysis from over 1000 experienced analysts on a range of views of the probable direction of the financial markets, thus enabling our readers to arrive at an informed opinion on future market direction. http://www.marketoracle.co.uk
Disclaimer: The above is a matter of opinion provided for general information purposes only and is not intended as investment advice. Information and analysis above are derived from sources and utilising methods believed to be reliable, but we cannot accept responsibility for any trading losses you may incur as a result of this analysis. Individuals should consult with their personal financial advisors before engaging in any trading activities.
Nadeem Walayat Archive |
© 2005-2022 http://www.MarketOracle.co.uk - The Market Oracle is a FREE Daily Financial Markets Analysis & Forecasting online publication.


