


Stock Markets Staring into the Abyss
Stock-Markets / Stocks Bear Market Nov 01, 2008 - 12:57 PM GMTBy: Colin_Twiggs

 The Paradox Of Thrift - A common topic of discussion in the media is the paradox of thrift — a term coined by John Maynard Keynes to describe the negative effect of increased savings on consumption. When threatened by recession we tend to consume less and save more. Keynes argued that the decrease in consumption has the effect of lengthening the recession. While accepted by many economists, this reasoning has a basic flaw. It assumes that savings and investment are independent of each other. In an ideal market-driven financial system, the two are directly linked, with savings financing new investment. An increase in savings would mean that interest rates are likely to fall. Falling interest rates would encourage new investment, more than offsetting the initial reduction in consumption.
Even with Keynesian-style intervention, where interest rates are set by the Federal Reserve (or central bank), savings and investment may be divorced, but are not independent. As Paul Krugman points out: a fall in consumption caused by an increase in savings would lead the Fed to slash interest rates, stimulating consumption and investment.
Government Spending Programs
Keynesian-style government spending programs are also being promoted by election candidates and in the media. We should not forget that, while governments are reasonably efficient at extracting money from taxpayers, they are highly inefficient when it comes to spending that money. Recently, an economist discussing stimulus packages suggested that about 30 percent of money spent by governments is wasted. I am sure many of you would agree: that estimate seems way too low.
Paying someone to sit at a desk doing nothing or building a bridge to nowhere may make GDP figures look better, but there is no real benefit to the economy. I can already hear the snorts of derision: "What about the benefit generated when those extra wages are spent?" This misguided thinking is evident in many government programs. There is no benefit. All that is done is remove money from the pocket of one person (the taxpayer) and placed it in the hands of another. Henry Hazlitt offered the analogy of smashing shop windows. This no doubt generates more employment and income for glaziers. But shopkeepers have to bear the additional expense — and are likely to pass this on to their customers. Shopkeepers and their customers are therefore deprived of the opportunity of spending that money for their own benefit.
The more public-spirited amongst us may be prepared to forego that additional benefit in order to employ more glaziers, but there is an additional consideration. We have now reduced the surplus (of income over consumption) that is normally used to save and invest. That means that there will be less investment in plant and machinery and new retail facilities; less employment generated in manufacturing these assets; and less employment in operating them. While we have created a new job for one glazier, we have done so at the expense of two or more manufacturing jobs. And exchanged productive plant and machinery for a broken shop window — or a bridge to nowhere.
The bottom line is that government spending programs intended to boost employment are generally ineffective and deplete private investment in new productive capacity. They are a lite version of Mao's Great Leap Forward — which eventually resulted in the death by starvation of up to 40 million Chinese.
The irony is that China now enjoys unparalleled prosperity as it opens its economy to free market forces — while western governments slide ever closer toward socialism.
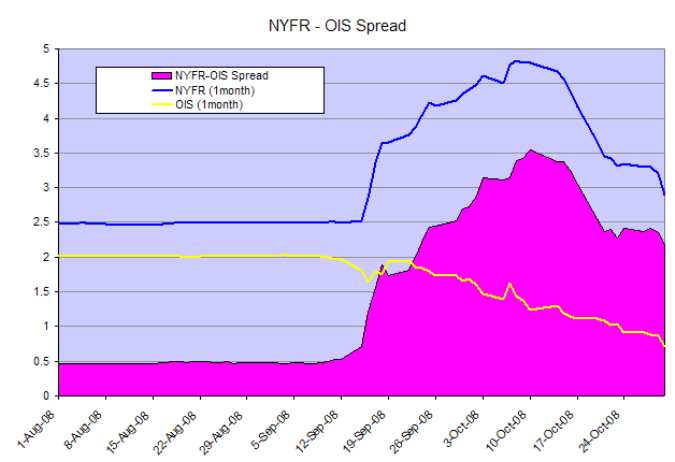
Banking Spreads
Inter-bank lending rates are declining, but the NYFR-OIS 1-month spread remains prohibitively expensive, at above 2.0 percent, choking the flow of credit to the economy. Spreads cannot continue at current levels without causing further instability.
USA
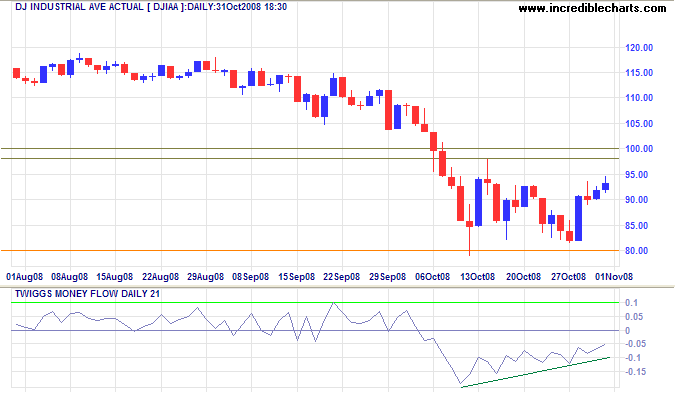
Dow Jones Industrial Average
The Dow respected support at 8000 and is rallying to confirm resistance at 10000. Twiggs Money Flow (21-Day) reveals short-term buying pressure, but remains below zero, signaling longer term weakness.
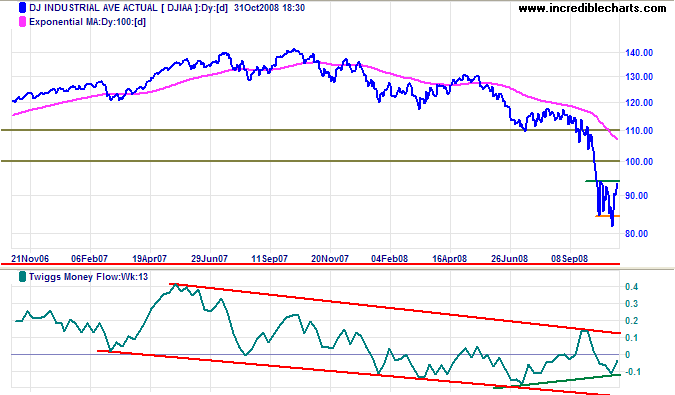
Long Term: Breakout below 8000 would test the 2002 low of 7300. The band of support between 7000 and 7300 represents the 50 percent retracement level for Fibonacci followers. Twiggs Money Flow (13-week) is tracking downwards, but would complete a bullish divergence if it breaks out of the recent trend channel. Long term investors need to be cautious as a bullish TMF divergence accompanied by a V-bottom on the price chart will not necessarily spell the end of the bear market.
S&P 500
The 40-year chart of the S&P 500 shows the end of a 30-year bull trend, with the 2008 break below the trend channel. Respect of support at 800 would suggest a lengthy period of consolidation, similar to the stagflation of the 1970s. Failure of support would warn of a bear trend similar to the 1930s. The Volume Oscillator peaks above 20 normally accompany a market turning point — as in 1970, 1974, 1982, 1987, 2002 and 2007. The signal is not infallible, however, and should only be used as supporting evidence.
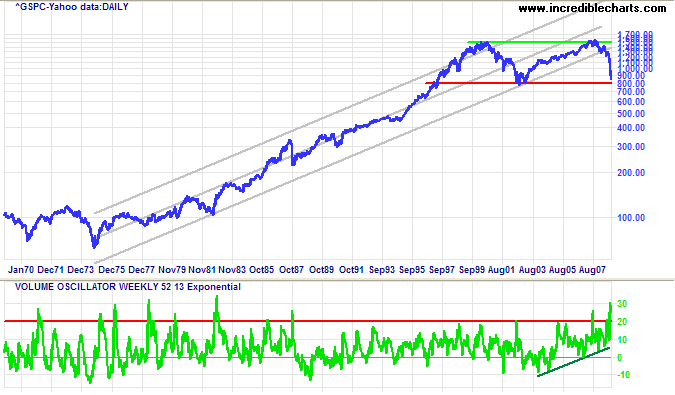
The 800 level is the edge of the abyss. Staring at the chart reminded me of Friedrich Nietzsche's saying: If you gaze long into an abyss, the abyss will gaze back into you. The more we reflect on a fall below 800, the more likely it is to occur.
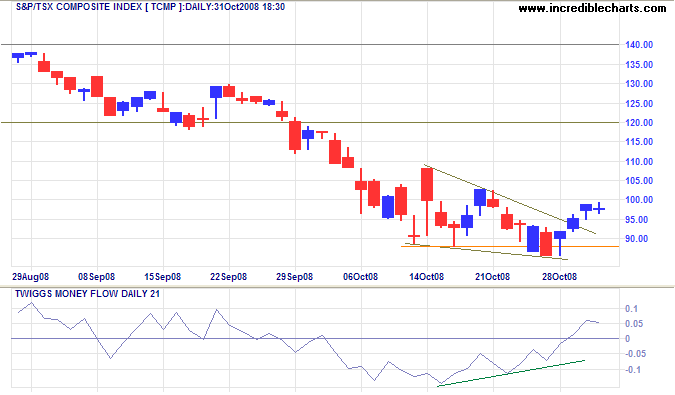
Canada: TSX
The TSX Composite broke out above a bullish falling wedge formation, signaling a test of 12000. Twiggs Money Flow (21-day) confirms short-term buying pressure. The primary trend remains down, however, and reversal below 9000 would test the August 2004 low of 8000.
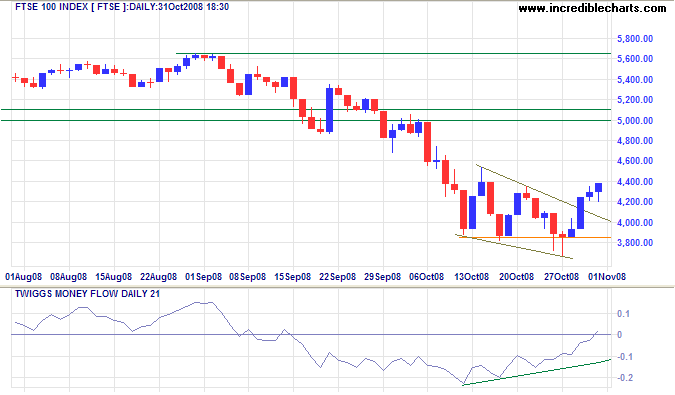
United Kingdom: FTSE
The FTSE 100 also displays a breakout above a bullish falling wedge formation, in this case signaling a test of the band of resistance between 5000 and 5100. Twiggs Money Flow (21-day) rising above zero signals short- to medium-term buying pressure. The primary trend remains down, however, and reversal below 3850 would test the 50 percent retracement level (and 2003 low) of 3300.
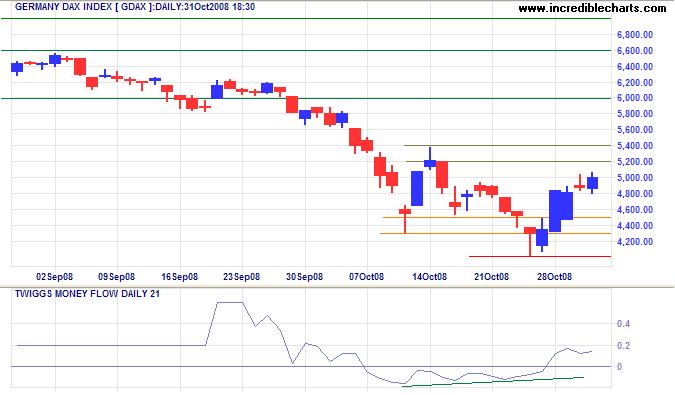
Europe: DAX
The DAX made a failed break below 4300 before retracing to test the band of resistance between 5200 and 5400. Upward breakout would signal a test of 6000. The primary trend is down, however, and reversal below support at 4000 would warn of a test of the August 2004 low of 3600.
|
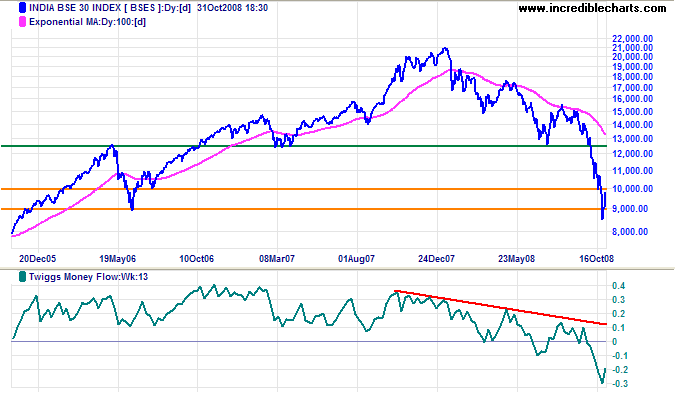
India: Sensex
The Sensex is retracing after a failed break below support at 9000, the June 2006 low. Declining Twiggs Money Flow (13-week) continues to signal strong selling pressure. The primary trend is down and we can expect another test of 9000 in the weeks ahead. Failure would offer a target of 6000, the 2005 low; while respect would indicate that the index may be forming a base.
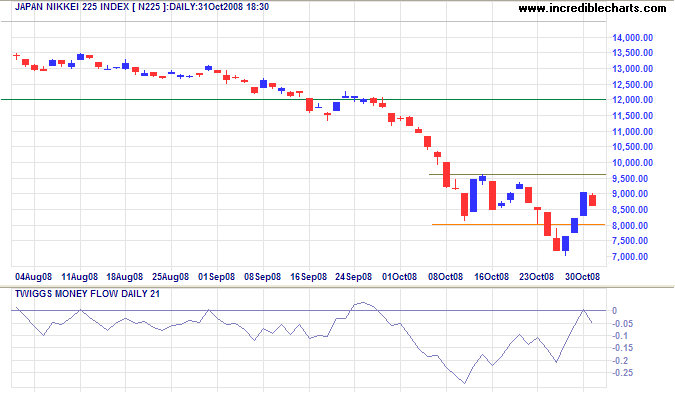
Japan: Nikkei
The Nikkei 225 is headed for a test of resistance at 9500, but the harami candlestick pattern warns of a reversal. Twiggs Money Flow (21-Day) displays a bullish divergence, indicating medium-term buying pressure. This would be strengthened by either a rise above the zero line or breakout above 9600 on the price chart. The primary trend remains down, however, and we can expect another test of the 25-year (2003) low of 7600. Failure would offer a target of 5500, calculated as 8500 - ( 11500 - 8500 ); while respect would suggest a possible base.
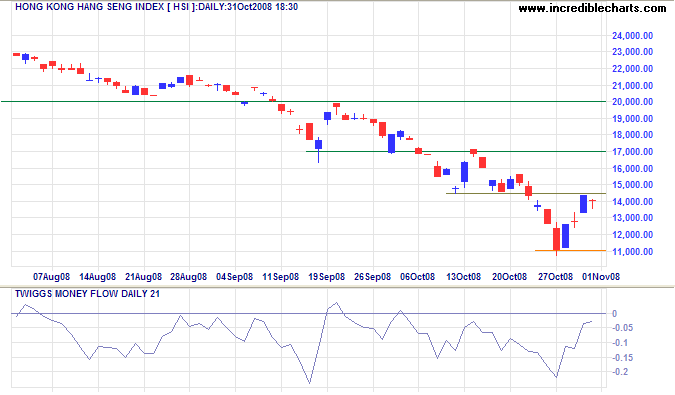
China
The Hang Seng retraced to test short-term resistance at 14500. The primary trend is down and reversal below 11000 would offer a target of 9000; breakout above 14500 is less likely — and would test resistance at 17000.
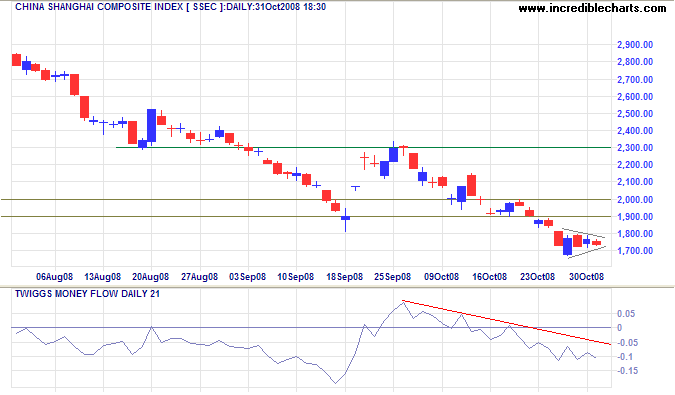
The Shanghai Composite formed a small pennant , signaling continuation of the down-trend. The primary target is the August 2006 low of 1500 — a 75 percent retracement. With most of their global customers entering a recession, China's export-led economy is likely to follow.
Incredible Charts Free Charting Software
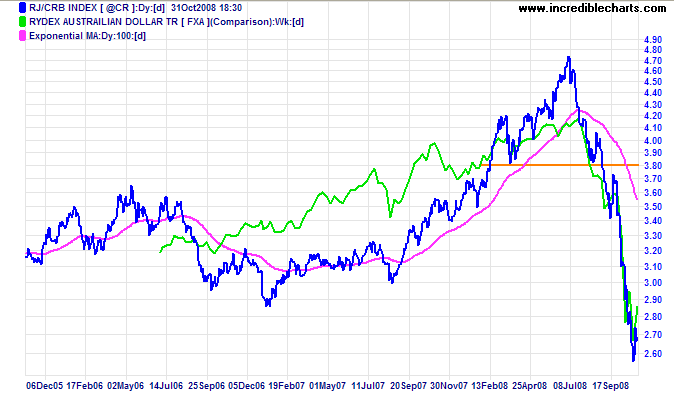
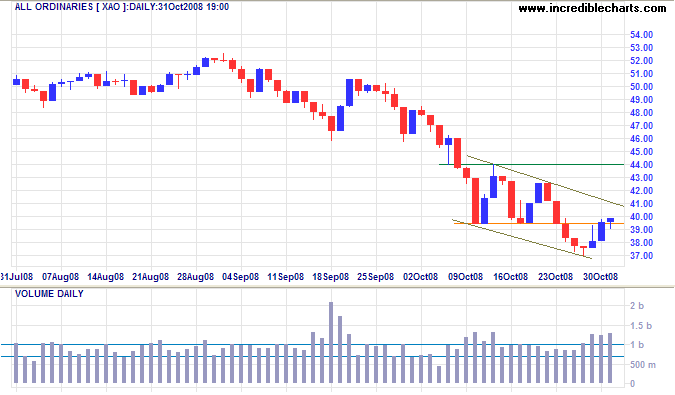
Australia: ASX
If China goes into recession, Australia will follow. Falling demand for commodities is best illustrated by the almost vertical drop in the CRB commodities index; accompanied by the falling Aussie Dollar.
The All Ordinaries displays a descending flag formation, signaling continuation of the down-trend. Strong volume over the last 3 days warns of rising selling pressure. Downward breakout from the flag is likely to test the 50 percent retracement level at 3400.
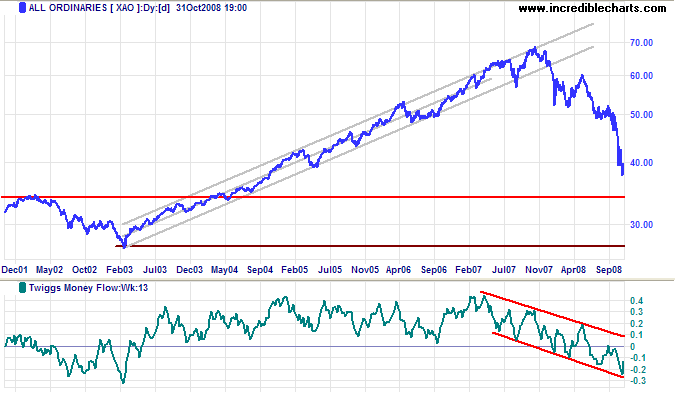
Long Term: The prospects of the mining sector are dependent on demand from China and India, while the property, construction and banking sector is likely to suffer further negative effects from the global credit contraction. The All Ords Twiggs Money Flow (13-week) index continues in a strong downward trend channel. I do not want to be alarmist, but there is now at least a 20 percent risk of the index testing 2700 — the 2003 low. That does not mean that it will definitely reach 2700, but the risk cannot be ignored.
Don't look at how much the company's stock has fallen.
Look at whether they will survive.
~ Adnan Kucukalic, Credit Suisse strategist.
By
Colin Twiggs
http://www.incrediblecharts.com
Colin Twiggs is the leading commentator at Incredible Charts where he writes the Trading Diary , with more than 70,000 subscribers. His specialty is blending fundamental analysis of the economy with technical analysis of stocks, markets, commodities and currencies. Focusing on the role of the Fed and banking credit as primary drivers of the economic cycle, Colin successfully forecast the October 2007 bear market — eight months ahead of the sub-prime crisis.
These extracts from my trading diary are for educational purposes and should not be interpreted as investment or trading advice. Full terms and conditions can be found at Terms of Use .
© 2008 Copyright Colin Twiggs - All Rights Reserved
Disclaimer: The above is a matter of opinion provided for general information purposes only and is not intended as investment advice. Information and analysis above are derived from sources and utilising methods believed to be reliable, but we cannot accept responsibility for any losses you may incur as a result of this analysis. Individuals should consult with their personal financial advisors.
John Henry Archive |
© 2005-2022 http://www.MarketOracle.co.uk - The Market Oracle is a FREE Daily Financial Markets Analysis & Forecasting online publication.