Stock Market Price Earnings Reversion Towards the Mean
Stock-Markets / Stock Market Valuations Oct 31, 2008 - 09:08 AM GMTBy: Hans_Wagner

 If you want to beat the market, it is a good idea to learn how the Price Earnings ratio (PE ratio) is used. To investors the PE ratio is the most widely used indicator of the value of a stock and of the market. When the PE ratio of the market index such as the S&P 500 is high, it is considered a sign that the market may be over valued. On the other hand when the PE Ratio of the S&P 500 is low, it is normally a sign that the market is under valued. What is the PE Ratio telling us now?
What is the Real PE Ratio
Investopedia defines the PE ratio as a valuation ratio of a company's current share price compared to its per-share earnings. Calculated as:
![]()
The market value per share is readily available. For the S&P 500 it is the closing price of the S&P 500 index.
The earnings number analysts use to determine the PE ratio varies. Some analysts use earnings as reported according to Generally Accepted Accounting Principles or GAAP. Others use operating earnings and some use core earnings. There are two good sources that can be used to determine the earnings in calculating the PE ratio. Standard & Poor's provides a wealth of data including a spreadsheet that contains the closing price of the S&P 500 along with actual and estimated earnings. They also include the calculated PE ratio. Known as the Standard & Poor's Earnings and Estimate Report , it includes Reported Earnings, Operating Earnings, Core Earnings, Pension Interest Adjustment, and other earnings.
Since about the mid 1990's analysts started to separate operating earnings from reported earnings as this presented a better picture of the “real” earnings of the company. The primary difference between reported earnings and operating earnings is what is written off. Those that believe operating earnings is a better number claim that write offs are not part of the core business and therefore should not be included in the calculation. This results in a higher PE ratio.
On the other hand those that believe reported earnings are better, believe that write offs are part of the operations of the company and should be counted. It is too easy to remove part of a company that is not performing well and exclude it from the earnings picture. Reported earnings present the true picture of how well a company is doing. Operating earnings provides investors an opportunity to see how the company might perform in the future after management writes off part of their business. When looking at the S&P data, be sure you know what earnings number is being used.
Standard & Poor's View
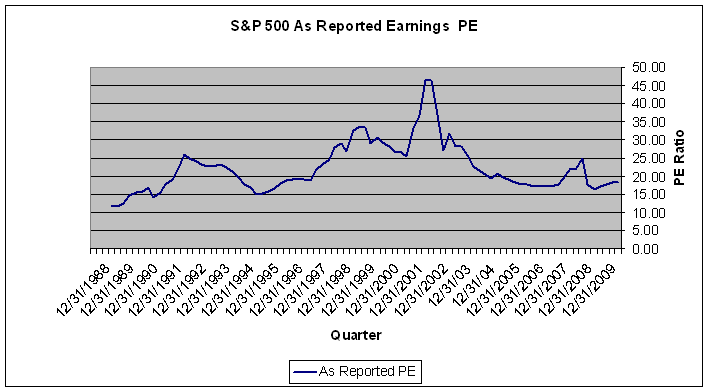
The chart below shows the PE ratio for the S&P 500 using reported earnings. It includes actual numbers up through June 2008 and estimates by Standard & Poor's for the remainder of 2008 and through 2009. As shown the actual PE ratio is declining as would be expected with the recent bear market. However, S&P's estimates for the remainder of 2008 and all of 2009 imply that there will be a slight expansion of the PE ratio. S&P forecasts that earnings will fall throughout 2009, delivering $48.96 in annual earnings for the year compared to $51.37 for the 12 months ending June 2008.

Source: Standard & Poor's Earnings and Estimate Report
To help forecast a projected PE ratio for the S&P 500 it is helpful to know some of its history.
The PE ratio for the S&P 500 has averaged about 15 over the past one hundred years. This ratio has also fallen to below 10 in the more severe bear markets as shown in the Table 1 below.

Table 1
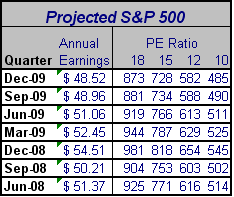
If we take the forecasted annual earnings for the S&P 500 through December 2009 and a range of PE ratios, we can develop an estimate for the S&P 500 over the next 15 months. On Friday, October 24, 2008 the S&P 500 closed at 876.77. If we assume the realized earnings forecast of $50.21 is close to correct number for the third quarter 2009 quarter, then this gives us a PE ratio of 17.46 for the S&P 500. The weakness in the economy should continue causing earnings to fall further. If we assume earnings reach a low of $48.96 (the forecast for 9/2009) and the PE ratio falls to just its average of 15, then the S&P 500 will reach a low of 734, or a further drop of 143 more points from Friday's close
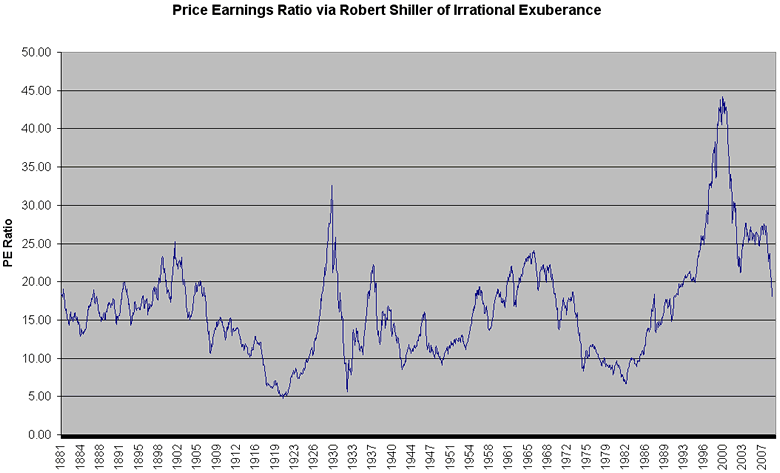
So what do the past serious bear markets tell us about how low the S&P 500 PE ratio can go? The chart below shows that in the bear market of 1977 to 1982 the PE ratio fell to the 7 to 10 range. In 1949 it fell to the 9 to 10 range and in 1942 it fell to the 8 to 9 range.
As shown in the table below, the S&P 500 can fall as low as 485 should the PE ratio fall to 10 and the earnings for the S&P 500 reach $48.52. How deep we fall in this recessionary phase will tell us how far the PE ratio will fall.

Table 2
Robert Shiller, Irrational Exuberance
Before we go any further, a quote from Benjamin Graham, the father of Value Investing and author of The Intelligent Investor: The Classic Text on Value Investing ![]() is worth reading.
is worth reading.
"In former times analysts and investors paid considerable attention to the average earnings over a fairly long period in the past – usually from seven to ten years. This average figure was useful for ironing out the frequent ups and downs of the business cycle, and it was thought to give a better idea of the company's earning power than the results of the latest year alone."
Robert Shiller of Irrational Exuberance: Second Edition ![]() fame follows Ben Graham's advice by using the inflation adjusted price divided by the prior ten-year mean of inflation-adjusted earnings. Fortunately, Shiller, maintains an extensive spreadsheet that includes his calculations of the PE ratio used in Irrational Exuberance. This spreadsheet does not offer forecasts of earnings or the PE ratio. However, looking back to prior serious bear markets should provide a guide. The dotcom bubble ended in 2003 with the PE ratio falling to just over 21. It turns out that other than the high tech industry earnings did not take a big hit and companies continued to perform well.
fame follows Ben Graham's advice by using the inflation adjusted price divided by the prior ten-year mean of inflation-adjusted earnings. Fortunately, Shiller, maintains an extensive spreadsheet that includes his calculations of the PE ratio used in Irrational Exuberance. This spreadsheet does not offer forecasts of earnings or the PE ratio. However, looking back to prior serious bear markets should provide a guide. The dotcom bubble ended in 2003 with the PE ratio falling to just over 21. It turns out that other than the high tech industry earnings did not take a big hit and companies continued to perform well.
However in 1982, 1951 and the 1932 we saw serious bear market declines with the PE ratio falling to below 10. Are we on our way to that level this time? The unraveling of the excessive leverage and the housing bubble still has a way to go. The global slowdown is just underway and the US deficit is expected to grow substantially due to lower tax collections and much higher spending by the government. These factors can provide the ingredients for the PE ratio to fall further, taking the market with it.
The chart below displays the PE ratio as calculated by Professor Shiller's method.

The Bottom Line
Most likely the PE ratio will be lower over the next 12 months. It should reach 15, its historical average as it reverts to its mean. The underlying fundamentals of the economy indicate that we will experience a more protracted recession than many analysts have thought. As a result the PE ratio will fall further, possibly reaching 10, bringing the market down with it. Of course, it will not plunge directily to that level. We should expect rebounds that can be used for relatively short term trades. These moves up offer investors the opportunity to close out current long positions, or add down side protection using covered calls, protective puts or going short. In any case, the market is still trending down over the longer term and it is wise to adjust your portfolio to reflect this situation.
If you are interested in learning more on how to use the PE ratio to predict secular market cycles I suggest reading:
Unexpected Returns: Understanding Secular Stock Market Cycles. by Ed Easterling. One of the best, easy-to-read, study of stock market cycles of which I know.
By Hans Wagner
tradingonlinemarkets.com
My Name is Hans Wagner and as a long time investor, I was fortunate to retire at 55. I believe you can employ simple investment principles to find and evaluate companies before committing one's hard earned money. Recently, after my children and their friends graduated from college, I found my self helping them to learn about the stock market and investing in stocks. As a result I created a website that provides a growing set of information on many investing topics along with sample portfolios that consistently beat the market at http://www.tradingonlinemarkets.com/
Copyright © 2008 Hans Wagner
Hans Wagner Archive |
© 2005-2022 http://www.MarketOracle.co.uk - The Market Oracle is a FREE Daily Financial Markets Analysis & Forecasting online publication.


