


Stock Market Crash Investor Overreaction Value Investing
Stock-Markets / Stock Market Valuations Oct 28, 2008 - 03:42 AM GMTBy: John_Mauldin

 How Should We Then Invest?
 - Those Wild And Crazy Analysts
- The Evidence for Investor Overreaction
- Stock Prices Are In Our Heads
- Or, Maybe Investors Are Just Head Cases
- Can We Actually Predict Earnings?
- Buffett versus Grantham
- Back to 1974?
Warren Buffett says buy. Jeremy Grantham says it will get worse. Both are celebrated value investors. Who is right? It all depends upon your view of the third derivative of investing. Today we look at valuations in the stock market. This is the second part of a speech I have given in the past few weeks in California and Stockholm. I am updating the numbers, as the target keeps moving. While from one perspective things look rather difficult, from another there is a ray of hope. What can you expect to earn from stocks over the next five years? It should make for an interesting letter. Note: this will be a little longer than usual, but part of it is there are a LOT of charts.
I should note that I am rewriting this on Monday. For the first time in over 8 years, I missed my Friday night deadline (see below). Last week's title for the letter was "The Economic Blue Screen of Death." By that I referred to the old "blue screen of death" that we used to get on early versions of Microsoft MS-DOS and Windows. You could be working away and suddenly, for no apparent reason, the computer would freeze up and you would get a blue screen. The only thing you could do was unplug the computer and hit the reset button - losing everything that was not saved when the computer crashed.
I likened this to the economic situation we are in now. With consumer spending "resetting" to a new lower level, we are going to have to hit the reset button on many business plans, and thus investments, as consumers are going to spend less and save more. Is that level 3% less? 5%? More? No one knows, but since we have not had a consumer-led recession since 1982, too many businesses assumed that the US consumer, like Superman, was bulletproof.
What will be the eventual savings rate? Will we get back to 7-9% from less than 1%? Maybe, because people are going to realize that savings today are the key to a happy retirement. That would put the new level of consumer spending a good deal lower than it has been. Thankfully, that climb in savings will not happen all at once but will play out over more than a few years. I think we will look back in the middle of the next decade and be quite amazed at how much US personal savings have increased. However, this is the Paradox of Thrift: what is good for the individual is hard on the economy, as by definition increased savings reduces consumer spending.
A quick point. This decrease in consumer spending that we are seeing now will not be a permanent condition. After we find that new lower level, consumer spending will start to grow again, albeit more slowly due to increased savings. That is because the US economy and population are growing, and increases in consumer spending are the norm in such conditions.
Now, and I have 100 Swedish witnesses for this, after I finished my speech Thursday morning in Stockholm for the institutional investors of Kaupthing Bank, I sat down and turned on my laptop, which is an Apple MacBook Air. There was a strange noise and then, I swear, I was staring at a blue screen. My Apple notebook, supposedly immune from the Blue Screen of Death, had frozen in a pale shade of blue. Later that night, over drinks, we speculated as to how Bill Gates could manage to do such things, remotely, in revenge. However, since the next day Apple in Malta could not fix it, I missed my deadline. I apologize. Now, let's jump right into the letter.
Those Wild And Crazy Analysts
Quick review: Last week we showed how consumer spending is falling, as we are in a recession. We then highlighted how analysts are dropping earnings estimates as time goes on. From projecting 15% earnings increases for 2008, they have dropped projections over 40% from March 2007 until today. Actual numbers will be much lower, as analyst projections for the fourth quarter are too high.
The same holds true for 2009. Since March of this year, just six months ago, earnings projections for 2009 have dropped 40% and are almost 10% lower than they were projected for 2008. However, estimates for operating earnings are still roughly double those for as-reported (or what's on the tax return) earnings. Analysts are still wildly overoptimistic. You can read last week's (October 17) letter here .
Now, let's look at the rest of the presentation. I argue in Bull's Eye Investing and this letter that we should look at long-term secular bull and bear markets not in terms of price but in terms of valuation. On September 26, 2003 I wrote about why we see long-term secular bear markets. I summarized the letter in the speech, but I think it will be useful to review a portion of it today. Remember, this was written in 2003, as a "new bull market" was already nearly a year old. The S&P 500 was at 1,000. So, for the last five years, you are down over 10%.
Investing is more than about price. It is about timing and valuations. Let's review. I put in bold some important points.
The Evidence for Investor Overreaction
Long-time readers know that it is my contention that we are in a decade-long secular bear market. It typically takes years for valuations to fall to levels from where a new bull market can begin. Why does it take so long? Why don't we see an almost immediate return to low valuations once the process has begun?
Because investors overreact to good news and underreact to bad news on stocks they like, and do just the opposite to stocks that are out of favor. Past perception seems to dictate future performance. And it takes time to change those perceptions.
This is forcefully borne out by a study produced in 2000 by David Dreman (one of the brightest lights in investment analysis) and Eric Lufkin. The work, entitled "Investor Overreaction: Evidence That Its Basis Is Psychological" is a well-written analysis of investor behavior which illustrates that perceptions are more important than the fundamentals. Let's look at that study in detail. Stay with me. This is important.
In any given year, there are stocks which are in favor, as evidenced by high valuations and rising prices. There are also stocks which are just the opposite. Dreman and Lufkin (or DL for the rest of this letter) look at a database for 4,721 companies from 1973 through 1998. Each year, they divide the database up into five parts, or quintiles, based on perceived market valuations. They separately study Price to Book Value (P/BV), Price to Cash Flow (P/CF), and the traditional Price to Earnings (P/E). This creates three separate ways to analyze stocks by value for any given year, so as to remove the bias that might occur from just using one measure of valuation.
The top and bottom quintiles become stock investment "portfolios" for all three valuation measures. You might think of them as a mutual fund created to buy just these stocks. They then look ten years back and five years forward for these portfolios. There is enough data to create 85 such portfolios or funds. They first analyze these portfolios as to how they do relative to the market or the average of all stocks. They then analyze the portfolios in terms of five basic investment fundamentals: Cash Flow Growth, Sales Growth, Earnings Growth, Return on Equity, and Profit Margin. They do this latter test to see if you can discern a fundamental reason for the price action of the stock.
First, both the "out-performance" and "under-performance" of these stocks happens in the ten years leading up to the formation of the portfolio. Almost immediately upon creating the portfolio, the price performance comparisons change, and change dramatically. The "in-favor" stocks underperform the market for the next five years, and the out-of-favor (value) stocks outperform the market.
I should point out that other studies, which Dreman does not cite, seem to indicate that the actual experience of many investors is more like these static portfolios than one might first think. That is because investors tend to chase price performance. In fact, the higher the price and more rapid the movement, the more new investors jump in. The Dalbar study, among many others, shows us that investors do not actually make what the mutual funds make because they chase the hottest funds, buying high and selling low when the funds do not live up to their expectations. The key word, as we will see later, is expectations. Other studies document that investors tend to chase the latest hot stock and shun those which are lagging in price performance. Thus, forming a portfolio of the highest-performing quintiles is an uncanny mirror to what happens in the real world.
Why does this "chasing the hot stock" happen? DL tells us it is because investors become overconfident that the trends of the fundamentals in the first ten years will repeat forever, "... thereby carrying the prices of stocks that appear to have the 'best' and 'worst' prospects. Investors are likely to forecast a future not very different from the recent past, i.e., continuing improving fundamentals for favorites and deteriorating fundamentals for out-of-favor issues. Such forecasts result in favorites being overpriced, while out-of-favor issues are priced at a substantial discount to the real worth. The extrapolation of past results well into the future and the high confidence in the precise forecast is one of the most common errors made in finance."
The more we learn about a stock, the more we think we are competent to analyze it and the more convinced we are of the correctness of our judgment.
Since you are not looking at the graphs, let me describe them for you. Predictably, the fundamentals improve quite steadily for the first ten years for the favorite stocks in comparison to the entire universe of stocks. But the price performance rises at very high rates, far faster than the fundamentals, particularly in the latter years. It clearly accelerates. It seems the longer a stock does well the more confident investors are that it will continue to do well and thereby award it with higher and higher multiples. The exact opposite is true of the out-of-favor stocks. Even though many of the fundamentals were actually slowly improving in relationship to the market as a whole, the stocks were lagging and the market punished them with ever-lower relative prices.
At five years prior to the formation of a portfolio, the trends of each group were set in place. The next five years just reinforced these trends. This re-strengthened the perceptions about these stocks and increased the level of confidence about the future. Again, past (and accumulated and reinforced over time) perception creates future price action.
Never mind that it is impossible for Dell to grow 50% a year or GE to compound earnings at 15% forever. As many times as we say it, investors continue to ignore the old saw "Past performance is not indicative of future results."
How much better did the good-performing stocks do than the bad-performing stocks in the ten years prior to creating the portfolios? The highest P/BV (Price to Book Value) stocks outperformed the market by 187%. The lowest stocks underperformed the market by -79%, for a differential of 266%! If you look at the P/CF (Price to Cash Flow) the differential between the two is 172%.
Yet in the next five years, the hot stocks underperformed the market by a negative -26% on a P/BV basis, and -30% on a P/CF basis. The out-of-favor stocks did 33% and 22% better than the market, respectively. This is a HUGE reversal of trend.
So, what happened? Did the trends stop? Did the former outcasts finally get their act together and start to show better fundamentals than the all-stars? The answer is a very curious "no."
"... there is no reversal in fundamentals to match the reversal in returns. That is, as favored stocks go from outperforming the market, their fundamentals do not deteriorate significantly, in some cases they actually improve.... The fundamentals of the 'worst' stocks are weaker than both those of the market and of the 'best' stocks in both periods."
In some cases, the trends of the worst stocks actually got worse. Even as the out-of-favor stocks improved in relative performance in the last five years, their cash-flow growth actually fell from 14.6% to 6.6%. While cash-flow growth for the best-performing stocks did drop by 6%, it was still almost 2.5 times that of the lower group. Read the following carefully:
"Thus, while there is a marked transition in the return profiles [share price], with value stocks underperforming growth in the prior period and outperforming growth stocks in the measurement period, this is not true for fundamentals. In nearly every panel [areas in which they made measurements], fundamentals for growth stocks are better than those for value stocks both before and after portfolio formation ."
"Although there is a major reversal in the returns [prices] to the best and worst stocks, there is no corresponding reversal in the fundamentals." In fact, in many cases the fundamentals continue to improve for the growth stocks and deteriorate for the value stocks. The data and the graphs clearly show that the fundamentals for the growth stocks clearly beat those of the value stocks, even for the five years after portfolio formation.
And yet, there was a very stark reversal in price. Why, if not based upon the fundamentals?
DL goes to another research paper, which shows "... that even a small earnings surprise can initiate a reversal in returns that lasts many years." They demonstrate that negative surprises on favorite stocks result in significant underperformance of this group not only in the year of the surprise but for at least four years following the initial event. They also show that positive surprises on out-of-favor stocks result in significant outperformance in the year of the surprise, and again for at least the four years following the initial event. DL attributes these results to major changes in investor expectations following the surprise.
So where was the overreaction? Was it in the years leading up to the surprise, which resulted in a very high- or low-priced stock (relative to the fundamentals), or was it in the immediate reaction to the surprise?
Other studies show analysts (as opposed to investors) are too slow to react to earnings surprises by being too slow to adjust earnings. Even nine months later, analysts' expectations are too high. (We will see this as we look at analyst performances today!)
Stock Prices Are In Our Heads Or, Maybe Investors Are Just Head Cases
Dreman and Lufkin then come to the meat of their analysis. For them, underreaction and overreaction are part and parcel of the same process. The overreaction begins in the years prior to the stock reaching lofty heights. As Nobel laureate Hyman Minsky points out, stability leads to instability. The more comfortable we get with a given condition or trend, the longer it will persist and then when the trend fails, the more dramatic the correction.
The cause of the price reversal is not fundamentals. It is not risk, as numerous studies show value stocks to be less risky.
"We conclude," they write "that the cause of the major price reversals is psychological, or more specifically, investor overreaction."
But DL go on to point out that when the correction comes, we tend to (initially) underreact. While we do not like the surprise, we tend to think of it as maybe a one-time thing. Things, we believe, will soon get back to normal. We do not scale back our expectations sufficiently for our growth stocks (or vice-versa), so the stage is set for another surprise and more reaction. It apparently takes years for this to work itself out.
As they note in their conclusion, "The [initial] corrections are sharp and, we suspect, violent. But they do not fully adjust prices to more realistic levels. After this period, we return to a gradual but persistent move to more realistic levels as the underreaction process continues through [the next five years]."
The studies clearly show it takes time for these overvalued portfolios to "come back to earth" or back to trend. Would this not, I muse, apply to overvalued markets as a whole? Might this not explain why bear market cycles take so long? Is it not just an earnings surprise for one stock which moves the whole market, but a series of events and recessions which slowly change the perceptions of the majority of investors?
Thus my contention that we are in just the beginning stages of the current secular bear market. These cycles take lots of time, anywhere from 8 to 17 years. We are just in year three, and at nosebleed valuation levels. The next "surprise" or disappointment will surely come from out of nowhere. That is why it is called a surprise. When it is followed by the next recession, stocks will drop one more leg on their path to the low valuations that are the hallmark of the bottom of secular bear markets. [Note: I wrote that in 2003.]
Given the level of investor overconfidence in the market place, and given the length of the last secular bull, it might take more than one recession and a few more years to find a true bottom to this cycle. It will come, of course.
But in the meantime, investors would do well do examine their own perceptions about the future, both positive and negative, and see if they might possibly be clouding their investment strategies. Remember, just because stocks are in a secular bear cycle does not mean there are not plenty of investment opportunities in other markets and strategies.
Just as there is more to life than work and money, there is more to investments than the stock market.
Can We Actually Predict Earnings?
Ed Easterling of Crestmont Reseach offers us the following very important chart. It is reported earnings compared to the historical trend line. As I have repeatedly written, earnings, especially when seen from a valuation standpoint, are mean reverting. They will fluctuate around the long-term trend line. And interestingly, that long-term trend line is nominal GDP. (Nominal GDP includes the effects of inflation.)
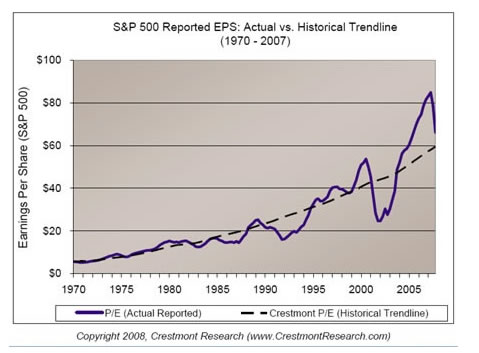
Total corporate earnings for any particular large country and stock market by definition cannot grow faster than nominal GDP (though individual stocks can do so). And since the S&P 500 is largely reflective of the US corporate world, earnings for the S&P 500 index will fluctuate around nominal GDP.
Notice how smooth that growth line for nominal GDP is? That will be important in a few paragraphs. But first, let's look at how well Easterling's historical trend line (which is nominal GDP) compares with Robert Shiller's ten-year smoothed earnings. Rather than use the earnings from any one year, which as we know can fluctuate wildly, he smoothes them by using a ten-year average.
Important: Notice how closely correlated the earnings for Crestmont's nominal GDP and Shiller's smoothed earnings are.
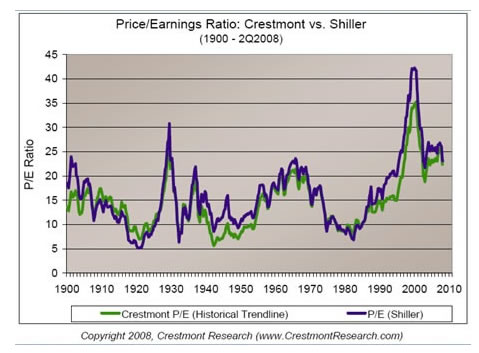
Now, this is where it gets interesting. Shiller's data is not predictive. But remember how smooth the earnings trend line from Crestmont was? Ed contends, and I agree, that there is a predictive element when we use nominal GDP. In other words, at some point in the future, earnings will grow back to and then exceed the long-term trend in nominal GDP.
So, while we are in the process of dropping below the mean or below the long-term trend line of earnings in terms of nominal GDP, we can be confident that at some point in the future those earnings will again revert above the mean . It seems to have been part of the economic laws since the time of the Medes and Persians.
This has important implications for future values. Let's look at the next graph, from Vitaliy Katsenelson. Vitaliy uses a 6% growth of earnings as his baseline (which is, not coincidentally, very close to the long-term rise in nominal GDP). Again, notice how earnings fluctuate around the mean.
Notice also the small box on the right, which show where earnings could actually fall to if earnings drop by the same percentage as they did in the 2000-02 recession. That would suggest that earnings will drop below $40, from the currently projected $48. Remember, last year projections for 2008 were $82.
We will come back to this; but if we can project that at some point in the future earnings will once again revert to nominal GDP trendline, then we can make some projections about what earnings will be in the future, or at least what "trend" earnings should be!
Buffett versus Grantham
On October 16 Warren Buffett wrote an op-ed in the New York Times called "Buy American. I am." Quoting from the beginning of the piece:
"THE financial world is a mess, both in the United States and abroad. Its problems, moreover, have been leaking into the general economy, and the leaks are now turning into a gusher. In the near term, unemployment will rise, business activity will falter and headlines will continue to be scary.
"So ... I've been buying American stocks. This is my personal account I'm talking about, in which I previously owned nothing but United States government bonds. (This description leaves aside my Berkshire Hathaway holdings, which are all committed to philanthropy.) If prices keep looking attractive, my non-Berkshire net worth will soon be 100 percent in United States equities.
"Why? A simple rule dictates my buying: Be fearful when others are greedy, and be greedy when others are fearful. And most certainly, fear is now widespread, gripping even seasoned investors. To be sure, investors are right to be wary of highly leveraged entities or businesses in weak competitive positions. But fears regarding the long-term prosperity of the nation's many sound companies make no sense. These businesses will indeed suffer earnings hiccups, as they always have. But most major companies will be setting new profit records 5, 10 and 20 years from now."
Jeremy Grantham, head of GMO, which manages $150 billion, has another opinion. Note that Grantham lost a great portion of his management business in the late '90s when he decided that the tech market was a bubble and did not participate. His huge pension fund clients decided he did not "get it" and left him in large numbers. He was right, they were wrong, and now his business is vastly larger. And again, he is putting his opinion and client money on the line. This from a recent Money Magazine article (courtesy of my friend Richard Russell):
"Historically, when a market bubble has popped, it has almost always overcorrected. But after the tech bubble burst in 2000, the stock market didn't hit the lows it should have. Before it could, the housing bubble and tax cut that followed 9/11 kicked off the biggest sucker rally in history from 2002 to 2006. So I think the market isn't cheap yet. There is more pain coming. I don't think we'll hit the low until 2010.
"Previously in the interview, Grantham had this to say. 'All you have to do is open a history book and see what happens when you have a bubble. In this case, there was a bubble in housing and there was a magnificent bubble in risk-taking People were just shoveling their money into risk on the pathetic idea that risk is always rewarded. You don't get rewarded for taking a risk. You get rewarded for buying cheap. Leverage is the ultimate demonstration of risk, and we never had system-wide leverage like this before. Ever. We had several firms that were leveraged 30 to 1(for every $30 of assets they put up $1 of equity and borrowed the other $29). At leverage of 30 to 1 you have to lose only about 3% of your $30 worth of assets and your dollar of equity gets wiped out. You're bankrupt."
So, who is right? And the answer depends on your view of what I call the third derivative of value investing. The first two are price and earnings. The third derivative is time .
Long-time readers know I contend that markets go from high valuations to low valuations and back to high over very long secular bull and bear markets which last anywhere from 13-20 years, or about 17 years on average. These cycles do not stop in the middle and reverse. They tend to go the full course. That is why I could contend back in 2003 that were we not in some new long-term bull market. Valuations had not reached the levels from which bull markets are made. Stock market cheerleaders tried to spin it, but valuations are the fundamental ground of investing. You ignore them at your own peril.
Now, let's look at two more charts from Vitaliy. These show the long-term secular cycles in terms of valuation, both from one-year and ten-year smoothed P/E ratios. Note that we are not back to even below the mean, much less to some place we could call "low."
So, let's be a bit of an optimist. Let's look at yet another chart from Crestmont Research. What happens if stock market earnings revert to the mean in either 3 or 5 years? Ed also assumes that P/E ratios once again rise back to 22.5. From last Friday's close, such a reversion would yield very handsome returns: 23.5% compounded for 3 years and 15.9 % for five years. If you believe like Buffett that US earnings will revert back to (and above) the mean, then that suggests this is a time to buy, if you are buying for the long term. The full report is at http://www.crestmontresearch. com/pdfs/Stock%20PE%20Report. pdf
Back to 1974?
Go back and look at the valuation charts above. Note that in late 1974 valuations were still at about their long-term average. Buying then was not compelling from a valuation standpoint. But Richard Russell called the bottom in one of his more famous calls late in the year. And it was a "price" bottom.
There was a great deal of volatility in the next eight years, and another recession at the end of the period, before valuations finally got down to extremely undervalued single-digit levels. Thus, those years saw a rising stock market and ever-lower P/E ratios. That happened as earnings grew faster than the prices of the stocks! Why did prices not rise along with the earnings growth?
Now, gentle reader, we come full circle, back to the Dreman and Lufkin study. Investors, twice burned in the late '60s and early '70s, were reluctant to get back into the market in a large, overtly bullish way. They were cautious.
I think we may be in a reflection of that same period. While it is possible we have put in the lows for this cycle, I think that as the recession will be deeper and longer than most of us have experienced (think 1982), we will see more rounds of earnings disappointments. I think the market has more downside in its future. But sometime, whether it was last week, or a few quarters in the future, we are going to see a cycle low in terms of price.
But it will most likely be a repeat of 1974-1982. Lots of volatility. Very large run-ups followed by quick and vicious sell-offs on the way back up to new highs. This is NOT going to be a recovery back to new highs in two years. This is going to take a long time. Further, I don't think nominal GDP will be 6% for the next three years, for reasons stated last week.
Investors are going to get their hearts broken by their favorite companies time and time again. The economic news will not be good for another year at a minimum. This is not the stuff that wild bull markets are made of. That time will come, but it is not yet.
That being said, I am a believer in American business. They will figure out how to maneuver and prosper in this new environment. In 12 years, earnings will have doubled from the trend of last year, which suggests earnings could be $140 in 2020. Put a multiple of 20 on that and we have an S&P 500 at 2,800, up over 3 times from today. That is the long view.
How Should We Then Invest?
Am I personally a buyer today, like Buffett? No, as I think that in a secular bear market you should see absolute returns rather than the relative returns of passive index investing. And, I think there is more pain to come in the market. But there are opportunities other than index funds or long-only mutual funds. So, where should we put money to work today?
- While I don't want to be long an index fund, if you are a stock picker (as Buffett is), then there is value out there. And if I am right and there is some more downdraft in the markets, then there will be more value in the near future. This is not a time for hope, it is a time for conviction. I wrote several long chapters in Bull's Eye Investing on value investing. Vitaliy Katsenelson recently wrote a book called Active Value Investing. It is a good guide. http://www.amazon.com/Active- Value-Investing-Range-Bound- Markets/.. Take your time. There is no hurry. But start your analysis and research now.
- I like active absolute return managers and investing. In particular, I like actively managed commodity funds which have a bias for volatility. Note: this is NOT an endorsement of long-only commodity index funds. Also, there are a small number of active managers who have demonstrated an ability to navigate this market. As Buffett says, it is not until the tide goes out that we know who is swimming naked. We now have a MUCH better idea of what volatility can do to an investment manager and his systems, and who understands the meaning of the word hedge.
- It is somewhat heretical to say it in this market, but there are specific styles of hedge funds I like. We are seeing the gut-wrenching demise of many black-box quantitative hedge funds. Hopefully, investors have learned their lesson. There is no free lunch. However, I think that long-short hedge funds (and the few mutual funds that use that style, like John Hussman's) will once again find an environment in which they can prosper. If you want to be in the market, this makes a lot more sense to me.
- I think that sometime next year it will be time to really think seriously about emerging market investments. Those markets have in general been beaten down far more than the developed-world markets. And the developed world is going to be growth-challenged in respect to emerging markets. You can find some real value. As an example, the largest liquor distributor in Thailand now pays an 8% dividend. Why? Because it was a large part of Thai index funds, and foreigners unloaded those funds in the current sell-off. And while Sweden can hardly be called emerging, last Thursday institutional investors were talking about the value there as foreigners have fled their markets, pushing values down.
Now, here's a rule. Write this down. If you are going to invest in an emerging market, make sure it is with someone who knows that local market. I do not want to have a manager with the name of Smith sitting in New York looking at a computer screen investing in Thailand for me, and neither should you! You need someone who understands the local scene. - Income is going to be critical. If you are going to put some money into bonds and other fixed-income instruments (not funds!), you should be doing it now. As I have been writing, there are simply steals out there in the fixed-income markets, as the margin clerks are forcing funds and individuals to sell any- and everything. The prices we see today will not be there in six months, and I doubt they will be there in three. If you are a fixed-income investor, you should be buying with both fists. But only if you know what you are doing. This is not the time for on-the-job training. Sometimes those bonds are selling at low numbers for a reason other than liquidity and margin calls. If you are not a seasoned fixed-income investor, then get professionals to help you. For portfolios of over $250,000 I can help you find a manager.
- As I wrote months ago, we are seeing the rise of a new asset class I call Private Credit. These income and asset-backed lending funds are going to take market share from banks and become a market force of their own.
- While today may not be the time in all markets, it will not be too long until you will be able to find either residential or commercial real estate at distressed prices almost anywhere, which you can buy and then rent out. Buying real estate at the right price and letting someone else pay down the loan is a proven formula for wealth in many a millionaire household.
In general, your target is not to beat the market. It is to beat zero. As I have written for years, the investors who win in this market are the ones who take the least damage.
Home Again and a New Home
It is good to be home from all my travels. Other than a trip to the Minyanville Christmas party in New York, I have no plans for travel until mid-January and not much more after that, although I know that will change. But it will be good to stay here and focus on writing the next book with Tiffani.
And speaking of home, I lease my abode, having sold my home years ago. I can lease cheaper than I can buy. But we now find in this market we can lease at even much better rates. We can lease a very large home in Dallas and move my office and small staff into part of it, cutting my total office and home payments by about 30-40%. There are several homes we have viewed that have good set-ups for a small office. In a few minutes, Tiffani and I will leave to go and look at the final selections, and we will make our choice. I will miss my office at the Ballpark, but saving one month a year in commute time as well as a lot of dollars just makes sense and cents.
This letter is overly long already, so I will hit the send button. Have a great week and remember, we will get through this.
Your looking for value analyst,
By John Mauldin
John Mauldin, Best-Selling author and recognized financial expert, is also editor of the free Thoughts From the Frontline that goes to over 1 million readers each week. For more information on John or his FREE weekly economic letter go to: http://www.frontlinethoughts.com/learnmore
To subscribe to John Mauldin's E-Letter please click here:http://www.frontlinethoughts.com/subscribe.asp
Copyright 2008 John Mauldin. All Rights Reserved
John Mauldin is president of Millennium Wave Advisors, LLC, a registered investment advisor. All material presented herein is believed to be reliable but we cannot attest to its accuracy. Investment recommendations may change and readers are urged to check with their investment counselors before making any investment decisions. Opinions expressed in these reports may change without prior notice. John Mauldin and/or the staff at Millennium Wave Advisors, LLC may or may not have investments in any funds cited above. Mauldin can be reached at 800-829-7273.
Disclaimer PAST RESULTS ARE NOT INDICATIVE OF FUTURE RESULTS. THERE IS RISK OF LOSS AS WELL AS THE OPPORTUNITY FOR GAIN WHEN INVESTING IN MANAGED FUNDS. WHEN CONSIDERING ALTERNATIVE INVESTMENTS, INCLUDING HEDGE FUNDS, YOU SHOULD CONSIDER VARIOUS RISKS INCLUDING THE FACT THAT SOME PRODUCTS: OFTEN ENGAGE IN LEVERAGING AND OTHER SPECULATIVE INVESTMENT PRACTICES THAT MAY INCREASE THE RISK OF INVESTMENT LOSS, CAN BE ILLIQUID, ARE NOT REQUIRED TO PROVIDE PERIODIC PRICING OR VALUATION INFORMATION TO INVESTORS, MAY INVOLVE COMPLEX TAX STRUCTURES AND DELAYS IN DISTRIBUTING IMPORTANT TAX INFORMATION, ARE NOT SUBJECT TO THE SAME REGULATORY REQUIREMENTS AS MUTUAL FUNDS, OFTEN CHARGE HIGH FEES, AND IN MANY CASES THE UNDERLYING INVESTMENTS ARE NOT TRANSPARENT AND ARE KNOWN ONLY TO THE INVESTMENT MANAGER.
John Mauldin Archive |
© 2005-2022 http://www.MarketOracle.co.uk - The Market Oracle is a FREE Daily Financial Markets Analysis & Forecasting online publication.