Is the Fed trying to blow another, more covert asset bubble?
Stock-Markets / Financial Markets 2022 Mar 21, 2022 - 06:14 PM GMTBy: Chris_Vermeulen
The asset bubble that almost ended in Q1 2020 was rescued by two main saviors, 1) unsustainable bearish (no, terrorized) sentiment and even more so, 2) balls out central bank inflation, led by the US Federal Reserve. The resulting bubble leg was in the bag from the moment the dovish Fed made its first headline about asset purchases and rate cuts.
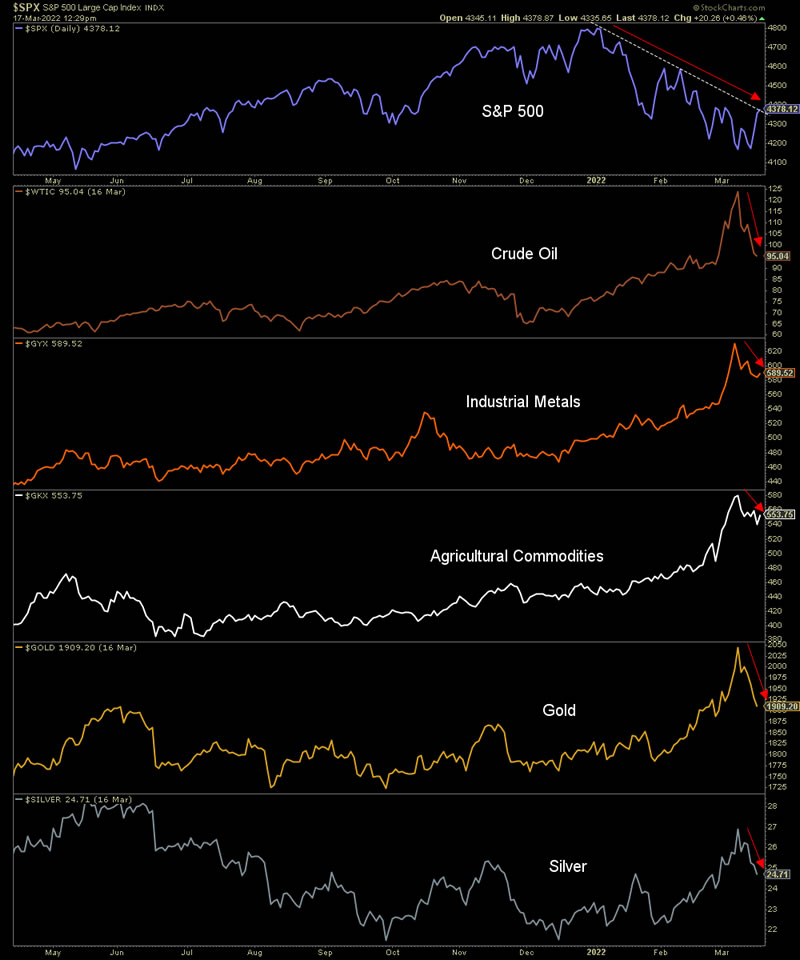
This latest leg of the asset bubble has been under stress in 2022, as the supposed reflection of ‘good’ inflation, the stock market (SPX), has trended down all year. More recently, commodities and precious metals have gotten dinged as well after spiking upward on the Russia/Ukraine war, which exacerbated the Fed’s inflation (as manufactured in Q1-Q2 2020) after the inflationary effects on commodity prices were already exacerbated by pandemic-related supply chain issues.

It is the top panel of the chart above that the Fed would probably prefer not to see make a terminal drop into a bear market. Thus far the broad US stock market’s intermediate trends have turned down but the major trends are still up. James Bullard was the lone FOMC member advocating a .5% hike in the Funds rate this week after telegraphing his position back in February. The rest of them? Well, you can tell by the look in Jerome Powell’s eyes that they are anything but hawkish.

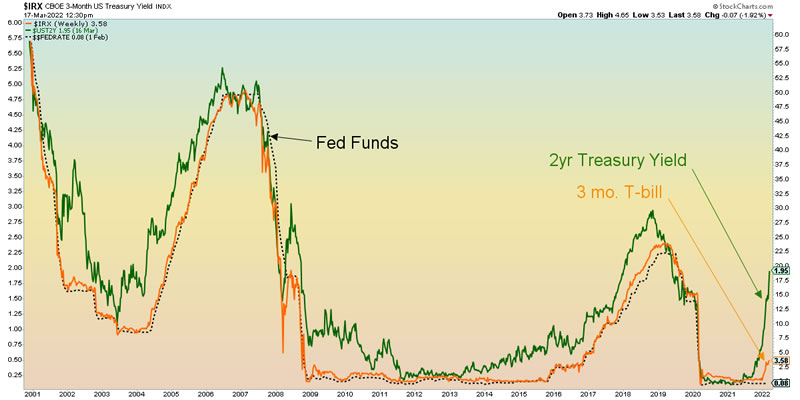
But why? Why, with the 3 month T-Bill yield literally demanding a stronger hawkish stance, did the Fed stand down with a wimpy .25%? The 2yr yield often leads a tardy Fed to eventually get in gear and start a rate hike regimen. But the T-Bill demands instant action. Ben ‘ZIRP Eternity’ Bernanke gave way to Janet Yellen, who finally ended ‘Zero Interest Rate Policy’ when the T-Bill yield rose in 2015.

It is likely that the Fed is watching economic indicators that matter (unlike the alarming and backward-looking inflation data that the media serve up every week), like the state of rising credit spreads, as described in this post. Or maybe they see the precarious state of the Copper/Gold ratio as noted in this post.
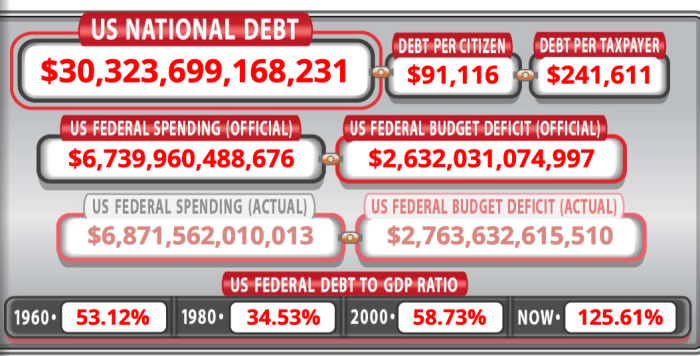
Or maybe they see the massive and constantly growing pile of US debt, as brought to you by the always entertaining Debt Clock (whee, it’s just numbers… what’s a few more zeros at the end?) with Powell loath to let it unwind just yet, under his watch.

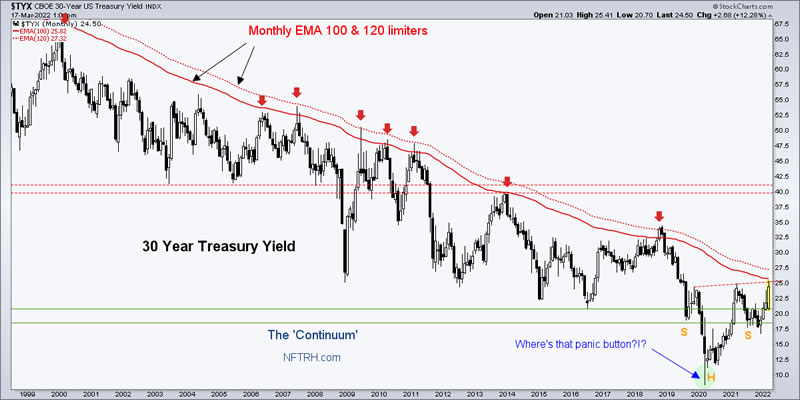
And so the Continuum dings the lower bound of our target this week.

Where do we go from here? Charles Bradley, for one, wants to know.
Referring to the Continuum chart above, we either go full frontal von Mises (i.e. inflationary/stagflationary/hellflationary crack-up-boom) or we reverse at the limiters (our target has been those very limiters since the inflation began in 2020), which have eased to the 2.5% to 2.7% zone.
In my opinion, the Fed would absolutely not want a breakout into a more virulent stagflation, but fears a reversal and liquidation as well (Fed in a box?). By remaining dovish (relative to the indicators like those on the first chart above), the Fed risks going hellflationary von Mises as commodities and resources (this time including, if not led by, gold and silver) flip them the bird for their paltry .25%. But it appears their bigger concerns at the moment are the implications on that debt pile with a bust into the next deflation scare and secondarily, a bear market in stocks.
If you love the markets as they are, this is the time to be engaged and not making assumptions or worse, following the assumptions of so called experts and opinion influencers. The robo trend out of mid-2020 was rewarding but tedious. Now it is time to get the macro right, go ‘top-down’ and short of ending up in a Unabomber shack with only canned goods and gold, profit on coming events. That is what NFTRH was made for. I don’t have a crystal ball telling me which way the macro will break, but I sure do have educated opinions based on the work done to this point. Said opinions will be refined and focused by the work upcoming. Of particular interest is the Fed itself and the macro questions it must deal with, as noted above.
For “best of breed” top down analysis of all major markets, subscribe to NFTRH Premium, which includes an in-depth weekly market report, detailed interim market updates and NFTRH+ dynamic updates and chart/trade setup ideas. You can also keep up to date with actionable public content at NFTRH.com by using the email form on the right sidebar. Follow via Twitter ;@NFTRHgt.
By Gary Tanashian
© 2022 Copyright Gary Tanashian - All Rights Reserved
Disclaimer: The above is a matter of opinion provided for general information purposes only and is not intended as investment advice. Information and analysis above are derived from sources and utilising methods believed to be reliable, but we cannot accept responsibility for any losses you may incur as a result of this analysis. Individuals should consult with their personal financial advisors.
Gary Tanashian Archive |
© 2005-2022 http://www.MarketOracle.co.uk - The Market Oracle is a FREE Daily Financial Markets Analysis & Forecasting online publication.


