


When Will the Stocks Bear Market End?
Stock-Markets / Stocks Bear Market Oct 27, 2008 - 02:49 PM GMTBy: Marty_Chenard

 Accelerated panic levels have hit the World Stock Markets ... What's next?
Let's start by discussing what is happening and why ... and then move on to our stock market Bull/Bear chart.
Extreme capitulation occurs in a progression where investors move from optimism & denial to fear, fear to panic, and then panic to despair.
We are now seeing the despair stage where investors try to bail out at any costs. This will cause more forced redemption selling by Hedge Funds and Mutual Funds. I expect the current accelerated process could last into the week of October 27th. before the selling is exhausted.
At the same time, credit default swaps and highly leveraged positions are being unwound. This all adds to the panic level and it squeezes the liquidity out of the markets.
The market has tried to establish a few rallies in the recent past, but has not been able to hold on to any of them. Part of the reason for this is that there has been substantial selling pressure from hedge funds facing redemptions . Until that pressure dissipates, the markets will not be able to find a rally that holds for any amount of time.
Some analyst expect unemployment to reach 7.5% by the end of 2009. Months ago, we projected a 5.8% level when the unemployment rate was just over 4.5%.
Now ... 7.5% by the end of 2009? We disagree, and this time we think we are more likely to see 8% unemployment within 8 months.
I am not trying to scare you, because forewarned is forearmed . It is just going to take time for all of the economic problems to unwind and resolve themselves.
CDSs and leveraged investments have to be unwound. Liquidity has to start flowing again, and banks have to start lending. (Currently, 1 in 4 new car buyers with excellent credit are being refused a loan.) Central banks have to act more aggressively and get the liquidity to flow again ... they are trying to do that now.
Meanwhile, the stock market discounts recessions and the future in the present. As that happens, fear and panic selling causes the market to overshoot how far down it should go . That gets compensated with up moves that brings the stock market closer to a real fair value ... so rallies have not gone away forever. They will be back ... and we are likely to see some pretty good ones after extreme oversold conditions.
But ... they will be Bear Market rallies until about 4 months before the recession ends. That is when the stock market typically bottoms out and has the start of a new fresh Bull Market.
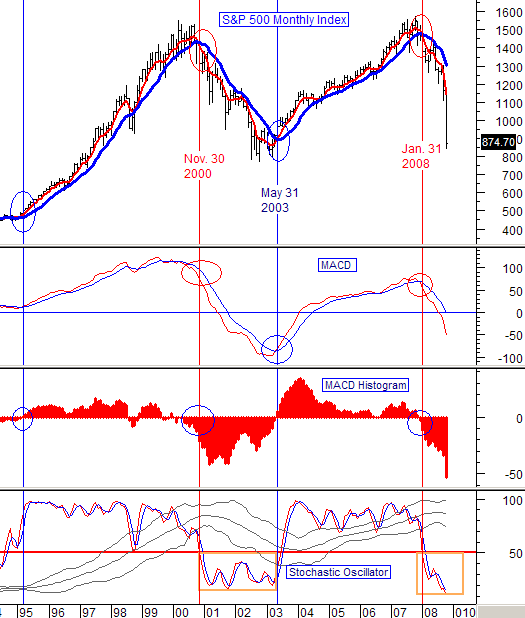
How far away is that? This chart will give you the answer ...
The chart below is shown every day in Section 5 of our paid subscriber sites and updated every Monday morning . It shows the timing of Bull-to-Bear market swings.
As you can see on the chart, we officially entered a Bear Market at the end of January of this year. The chart does not need a lot of explanation. Even a casual observe can see the correlation with the indicators and where they are now.
So when will the Bear Market end? It will officially end when our Monthly MACD has a cross over, and the MACD Histogram goes above zero, and when the Oscillator is about ready to move above the lower band . The recession is just starting, has a ways to go, and will likely be worse than people want to see.
Bear Markets typically have about 3 upside rally events on its ride to the downside. We should have two more before we have a chance to establish a bottom. The upside rallies can typically last two months each , so there will be times to go long while we move through a recession.
______________________________________________________________________
*** Feel free to share this page with others by using the "Send this Page to a Friend" link below.
By Marty Chenard
http://www.stocktiming.com/
Please Note: We do not issue Buy or Sell timing recommendations on these Free daily update pages . I hope you understand, that in fairness, our Buy/Sell recommendations and advanced market Models are only available to our paid subscribers on a password required basis. Membership information
Marty Chenard is the Author and Teacher of two Seminar Courses on "Advanced Technical Analysis Investing", Mr. Chenard has been investing for over 30 years. In 2001 when the NASDAQ dropped 24.5%, his personal investment performance for the year was a gain of 57.428%. He is an Advanced Stock Market Technical Analyst that has developed his own proprietary analytical tools. As a result, he was out of the market two weeks before the 1987 Crash in the most recent Bear Market he faxed his Members in March 2000 telling them all to SELL. He is an advanced technical analyst and not an investment advisor, nor a securities broker.
Marty Chenard Archive |
© 2005-2022 http://www.MarketOracle.co.uk - The Market Oracle is a FREE Daily Financial Markets Analysis & Forecasting online publication.