


The Put / Call Ratio – A Technique Used To Gauge Stock Market Extremes
InvestorEducation / Technical Analysis Mar 04, 2022 - 06:42 PM GMTBy: Chris_Vermeulen

Perhaps you’ve heard of the “Put / Call Ratio” (PCR) and been unsure of exactly what it is or when and how to use it.
First, a quick review of what Calls and Puts are. Calls are option contracts that increase in value from a RISE in the price of the underlying stock or index. Puts are option contracts that increase in value from a DROP in the price of the underlying stock or index.
Let’s jump in and see what’s “under the hood” and how we might use that to better inform our decision-making as traders and investors.
What Is the Put / Call Ratio?
The PCR is a contrarian indicator based on the idea that market participants tend to get too bearish or bullish shortly before a reversal is about to materialize. When the market is at a point of extreme bearishness, participants tend to buy more Puts than usual. Conversely, when the market is at a point of extreme bullishness, participants tend to buy more Calls than normal. Contrarian logic suggests that most participants tend to be wrong when the market is near inflection points.
Mathematically the Put / Call Ratio is simply the number of Puts divided by the number of Calls. A value of 1 would indicate that the same number of Calls and Puts are being purchased. A value greater than 1 indicates more Puts than Calls purchased. It follows that a value below 1 means that more Calls than Puts are purchased.
Be sure to sign up for our free market trend analysis and signals now so you don’t miss our next special report!
The PCR can be calculated using either open interest or volume of contracts. It can be calculated for individual stocks and for indexes. Most trading and charting platforms have several versions of the PCR available for the major indexes. Indexes generally have charts available, while individual stocks may only have daily numerical value readily available. The PCR is generally more useful as an overall market sentiment indicator for the major indexes like the S&P 500.
For most underlying, including major indexes like the S&P 500, the PCR tends to be below 1 much of the time. That makes some sense, as major indexes tend to have a long-term bullish bias. But in times of elevated fear, Put buying tends to be elevated in a rush to buy portfolio “insurance”. Outright bets on a market decline can add to that volume.
How Do I Use the pcr?
It helps to understand what “normal” behavior is for the number of Calls and Puts purchased for the particular index or stock. For an index like the S&P 500, a PCR of 0.9 or above suggests heavy Put buying and is typically seen as bullish from the contrarian view. For reference, at the height of the dot-com bubble in March 2000, the PCR dropped to as low as 0.39. Lots of calls were being purchased as the market was peaking.
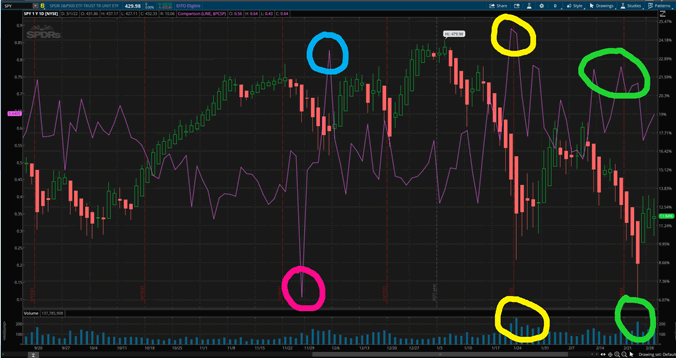
Let’s look at some recent examples where we see the Put / Call Ratio at extreme levels. Below we see a chart of the S&P 500 displayed with Heikin Ashi candles overlayed with the PCR (magenta line).
In the first instance (circled in magenta), we see a low in the PCR where significantly more Calls than Puts were purchased. When interpreted as a contrarian indicator, that suggests bearishness to come. And indeed, we do see five days of bearishness to follow.
We then see a sharp reversal to a relatively high PCR (blue circle), and we do see a bullish reversal that lasted for six days.
At the yellow circle, we see a spike up in the PCR accompanied by a sharp increase in the underlying volume. However, we see a few days delay before the bullish reversal materializes in this instance. And the market was rather volatile on those days, as evidenced by the tall candles with long tails.
At the green circle, we have a somewhat elevated PCR and another delayed reversal.
Conclusion
The PCR is not particularly useful in sideways markets. But it can be useful at market extremes, albeit at times with some delay.
Like many indicators, the PCR is far from 100% reliable unto itself. Used in conjunction with volume, volatility (VIX), support/resistance levels, trendlines, moving averages, and other technical indicators, the PCR can give us valuable clues about market sentiment and when a reversal may be in the making.
Now That You Know more About the put / call ration, Read On To Learn More About Options Trading
Every day on Options Trading Signals, we do defined risk trades that protect us from black swan events 24/7. Many may think that is what stop losses are for. Well, remember the markets are only open about 1/3 of the hours in a day. Therefore, a stop loss only protects you for 1/3 of each day. Stocks can gap up or down. With options, you are always protected because we do defined risk in a spread. We cover with multiple legs, which are always on once you own.
If you are new to trading or have been trading stock but are interested in options, you can find more information at The Technical Traders – Options Trading Signals Service. The head Options Trading Specialist Brian Benson, who has been trading options for almost 20 years, sends out real live trade alerts on actual trades, such as TSLA and NVDA, with real money. Ready to check it out, click here: TheTechnicalTraders.com.
Have a great day!
Chris Vermeulen
www.TheTechnicalTraders.com
Chris Vermeulen has been involved in the markets since 1997 and is the founder of Technical Traders Ltd. He is an internationally recognized technical analyst, trader, and is the author of the book: 7 Steps to Win With Logic
Through years of research, trading and helping individual traders around the world. He learned that many traders have great trading ideas, but they lack one thing, they struggle to execute trades in a systematic way for consistent results. Chris helps educate traders with a three-hour video course that can change your trading results for the better.
His mission is to help his clients boost their trading performance while reducing market exposure and portfolio volatility.
He is a regular speaker on HoweStreet.com, and the FinancialSurvivorNetwork radio shows. Chris was also featured on the cover of AmalgaTrader Magazine, and contributes articles to several leading financial hubs like MarketOracle.co.uk
Disclaimer: Nothing in this report should be construed as a solicitation to buy or sell any securities mentioned. Technical Traders Ltd., its owners and the author of this report are not registered broker-dealers or financial advisors. Before investing in any securities, you should consult with your financial advisor and a registered broker-dealer. Never make an investment based solely on what you read in an online or printed report, including this report, especially if the investment involves a small, thinly-traded company that isn’t well known. Technical Traders Ltd. and the author of this report has been paid by Cardiff Energy Corp. In addition, the author owns shares of Cardiff Energy Corp. and would also benefit from volume and price appreciation of its stock. The information provided here within should not be construed as a financial analysis but rather as an advertisement. The author’s views and opinions regarding the companies featured in reports are his own views and are based on information that he has researched independently and has received, which the author assumes to be reliable. Technical Traders Ltd. and the author of this report do not guarantee the accuracy, completeness, or usefulness of any content of this report, nor its fitness for any particular purpose. Lastly, the author does not guarantee that any of the companies mentioned in the reports will perform as expected, and any comparisons made to other companies may not be valid or come into effect.
Chris Vermeulen Archive |
© 2005-2022 http://www.MarketOracle.co.uk - The Market Oracle is a FREE Daily Financial Markets Analysis & Forecasting online publication.