


Consumer Price Index (Less Food & Energy) Climbs To Highest Levels Since 2007-08
Economics / Inflation Dec 20, 2021 - 02:03 PM GMTBy: Chris_Vermeulen

In Part I and Part II of this research article, I shared my research into the state of past and current US and global economy, Rest Of World Debt, DGP Implicit Price Deflator, Fed Funds Rates, and other technical data charts. The purpose of this article is to share with you two key components of the current US and global market trends; higher inflationary trends and a potentially trapped US Federal Reserve.
Be sure to sign up for our free market trend analysis and signals now so you don’t miss our next special report!
I will share more data/charts, and my proprietary US economy/Fed modeling systems results in Part III. My objective is to share my belief that the US Federal Reserve still has room to adjust interest rates (within reason) and how the US/global economy is starting to trend into the highest inflationary levels since 1975~1985. These levels could frighten traders/investors, but given the global economic constraints of the COVID lock-downs, I consider the current economic trends a symptom of the stimulus/solution – not necessarily an inherent economic trend. Allow me to explain my thinking in more detail.
Consumer Price Index (Less Food & Energy) Climbs To Highest Levels Since 2007-08
This Consumer Price Index (Less Food & Energy) paints a powerful picture. As you are well aware, the Energy sector (Oil and Natural Gas) has rallied more than 300% over the past 18+ months. Food, in particular Beef and other staple products, have rallied more than 80% over the past 18+ months. So this Consumer Price Index chart that is excluding two of the highest inflationary consumer components should already be well above the 1999-2000 levels if we consider real consumer price factors.
Take a minute to review all of these charts and consider the current US and global economic environment and where you think these trends may continue into early 2022.
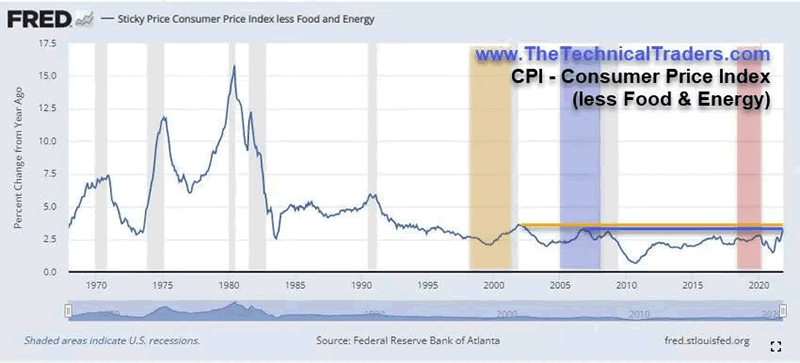
(Source: Fred Economic Data)
The extreme US and Global market debt levels, which have risen more than 500% over the past 15+ years, complicate the process of combating inflationary trends. The Fed, and many global central banks, risk a broad wave of defaults if they attempt to raise lending rates too fast. They want an orderly deleveraging process to occur, which will prompt a moderate deflationary trend in assets.
Consumer Price Indexes rallying to levels not seen since the 1970s or 1980s when the US Federal Reserve continues stimulus programs and keeps the FFR levels near ZERO seems counterproductive. But what if the US Federal Reserve is trapped behind a wall of debt and a very keen understanding that any aggressive moves may topple the global growth phase we’ve experienced over the past 8+ years? What if the US Fed knows they should be raising interest rates right now but is frightened to take this action because of what may happen to the rest of the world?
Proprietary Modeling Of The US Economy/Fed
Many years ago, I completed some prototype research related to the US debt levels as it related to GDP, Population, and economic activity. At that time, I attempted to model different outcomes over the next 20 to 25+ years. I tested various hypothetical outcomes to see how my modeling system would allow the US Fed to raise or lower rates within an “optimum range.” I’ve organized the results of my theoretical modeling into a table (below).
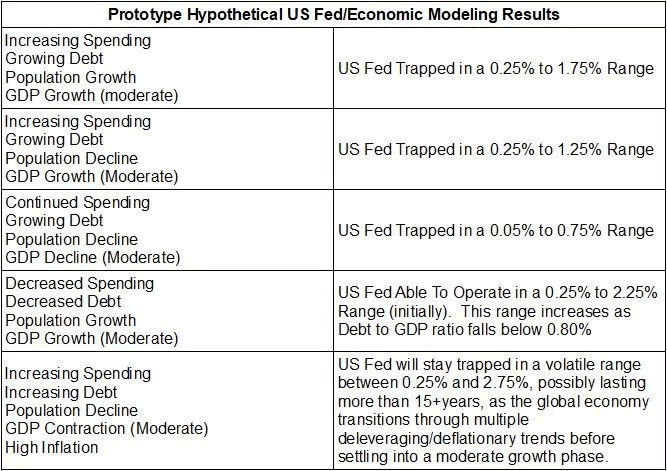
I believe this data, and all the charts I’ve shared with you in the whole of this research article, suggests the US Fed is trapped in a very strenuous position right now. The inflationary data suggests the US Fed should be aggressively raising rates. The global markets and the fragility of the global economy based on years of stimulus and easy money policy may prompt a shattering of market trends if the Fed acts too aggressively. What is the Fed most likely to do over the next 4 to 12+ months?
Maybe the US Federal Reserve is willing to push the envelope by:
- keeping rates low
- allowing foreign markets to deleverage and devalue in an orderly process
- allowing the markets to divest of the excess liabilities/debts
At the same time, they continue to support the US economy with easy money policies – thus allowing the foreign markets to shake off the liabilities and debt levels on their own.
Telegraphing The Long-Term, Slow-Motion, Fed Actions Going Forward
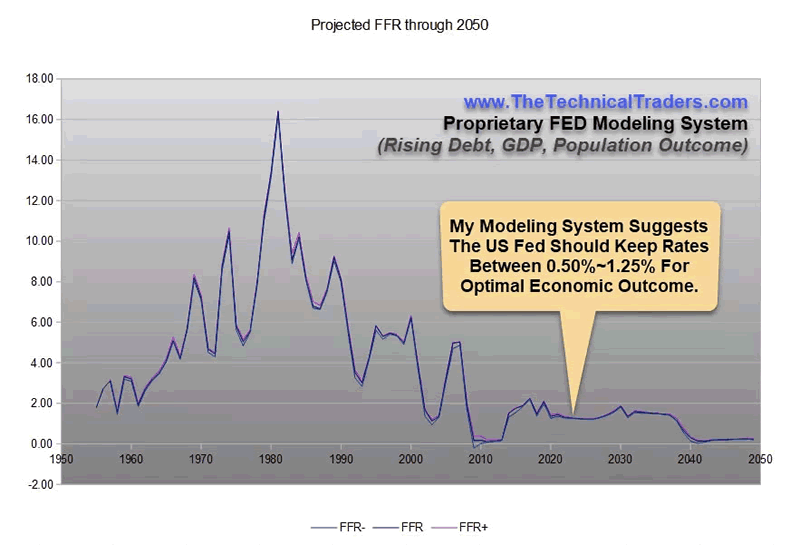
It makes sense that the US Federal Reserve may attempt to raise interest rates very slowly in 2022, possibly moving 1/8% or 1/4% at a time while keeping the FFR lending rate below 1.0% to 1.25%. Remember, my research suggests any aggressive moves by the UF Fed could topple the US and global markets fairly quickly at these extended inflationary and consumer price trends.
A prolonged and properly telegraphed US rate rise moving the US interest rates up above 0.50% would be a suitable solution, in my opinion, to attempt to eliminate the excessive leverage that has taken place throughout the developing world. As we see in China, Asia, Africa, the US, and other places, economic functions tend to have a natural process of handling extreme excesses.
My opinion is the world is experiencing and seeing the symptoms of excessive stimulus, extended easy monetary policy, COVID lock-down supply issues, and the effects of manufacturing globalization through the process of a virus/pandemic event. Almost like a perfect storm, the global markets before COVID in February 2020 were uniquely positioned to be highly dependent on China/Asia for certain medical, chip, and other manufacturing components while shipping and supply trends collapsed. For the first 4 to 6+ months, the US worked through existing inventory/supplies. But after those supplies were exhausted, the US economy became dependent on new shipments to replenish inventory and to supply much-needed manufacturing components. This perpetual supply-side shortage has continued to prompt higher inflationary trends worldwide.
Slowly changing direction
I expect the US Federal Reserve to very clearly telegraph next year’s expectations with an evident intent to move away from extended stimulus and support programs slowly. A very slow rate increase, possibly moving rates above 0.50% before August 2022, could be in the works. The US Federal Reserve will want to adjust rates and policy to assist the global economy in efficiently transitioning through the current inflationary, deleveraging, and deflating the excessive price trends – not breaking the markets.
Expect the US Federal Reserve to announce very clear longer-term “intentions” and to telegraph their expectations related to inflation and supply issues. Here are my expectations in a nutshell:
- Potentially cut the bond-buying rates by another 15% to 45% in early 2022 (Q1:2022 through Q3:2022).
- Announce intentions to raise rates very slowly in late Q1:2022 or late Q2:2022 (possibly raising in tiny increments over many months).
- Announce the US Fed is watching the global markets and credit markets quite intently – attempting to identify subtle shifts in trends and activity while adjusting future actions/expectations.
The US Federal Reserve has room to raise rates 0.50% or a bit higher. It also has many other tactics to tighten (bond-buying, liquidity features, financial stress-based requirements). I believe the Fed will make very clear “baby steps” known – but not take any immediate actions.
Want to learn more about what affects the markets?
Learn how I use specific tools to help me understand price cycles, set-ups, and price target levels. Over the next 12 to 24+ months, I expect very large price swings in the US stock market and other asset classes across the globe. I believe the markets are starting to transition away from the continued central bank support rally phase and may start a revaluation phase as global traders attempt to identify the next big trends. Precious Metals will likely start to act as a proper hedge as caution and concern start to drive traders/investors into Metals.
If you need technically proven trading and investing strategies using ETFs to profit during market rallies and to avoid/profit from market declines, be sure to join me at TEP – Total ETF Portfolio.
Have a great day!
Chris Vermeulen
www.TheTechnicalTraders.com
Chris Vermeulen has been involved in the markets since 1997 and is the founder of Technical Traders Ltd. He is an internationally recognized technical analyst, trader, and is the author of the book: 7 Steps to Win With Logic
Through years of research, trading and helping individual traders around the world. He learned that many traders have great trading ideas, but they lack one thing, they struggle to execute trades in a systematic way for consistent results. Chris helps educate traders with a three-hour video course that can change your trading results for the better.
His mission is to help his clients boost their trading performance while reducing market exposure and portfolio volatility.
He is a regular speaker on HoweStreet.com, and the FinancialSurvivorNetwork radio shows. Chris was also featured on the cover of AmalgaTrader Magazine, and contributes articles to several leading financial hubs like MarketOracle.co.uk
Disclaimer: Nothing in this report should be construed as a solicitation to buy or sell any securities mentioned. Technical Traders Ltd., its owners and the author of this report are not registered broker-dealers or financial advisors. Before investing in any securities, you should consult with your financial advisor and a registered broker-dealer. Never make an investment based solely on what you read in an online or printed report, including this report, especially if the investment involves a small, thinly-traded company that isn’t well known. Technical Traders Ltd. and the author of this report has been paid by Cardiff Energy Corp. In addition, the author owns shares of Cardiff Energy Corp. and would also benefit from volume and price appreciation of its stock. The information provided here within should not be construed as a financial analysis but rather as an advertisement. The author’s views and opinions regarding the companies featured in reports are his own views and are based on information that he has researched independently and has received, which the author assumes to be reliable. Technical Traders Ltd. and the author of this report do not guarantee the accuracy, completeness, or usefulness of any content of this report, nor its fitness for any particular purpose. Lastly, the author does not guarantee that any of the companies mentioned in the reports will perform as expected, and any comparisons made to other companies may not be valid or come into effect.
Chris Vermeulen Archive |
© 2005-2022 http://www.MarketOracle.co.uk - The Market Oracle is a FREE Daily Financial Markets Analysis & Forecasting online publication.