Stock Market Long-Term Projections Not Pretty
Stock-Markets / Financial Crash Oct 25, 2008 - 02:19 PM GMTBy: Mike_Paulenoff

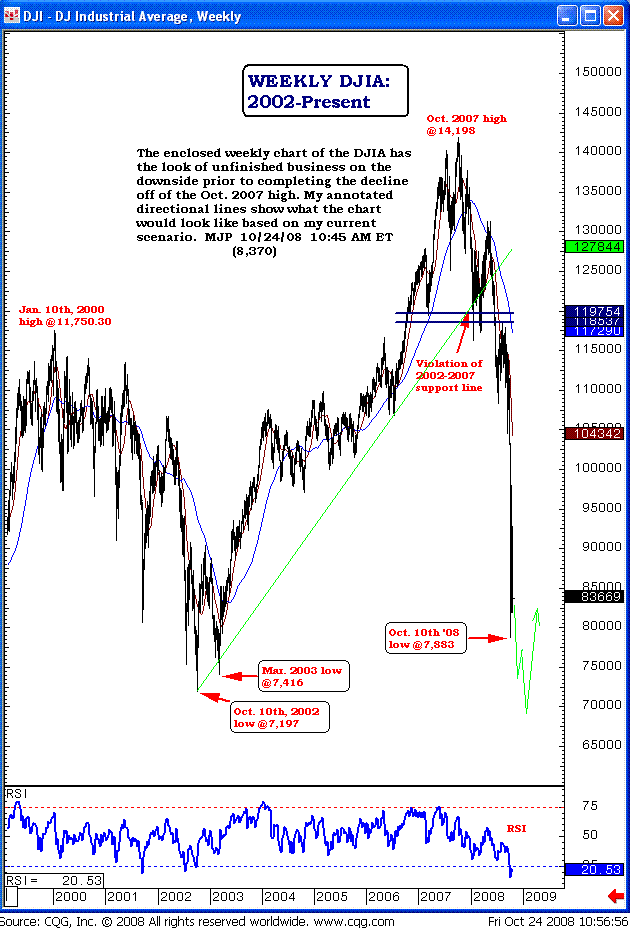
 The enclosed weekly chart of the DJIA has the look of unfinished business on
the downside prior to completing the decline off of the October 2007 high.
My annotated directional lines show what the chart would look like based on
my current scenario of the Dow heading towards the October 2002 low below
7200.

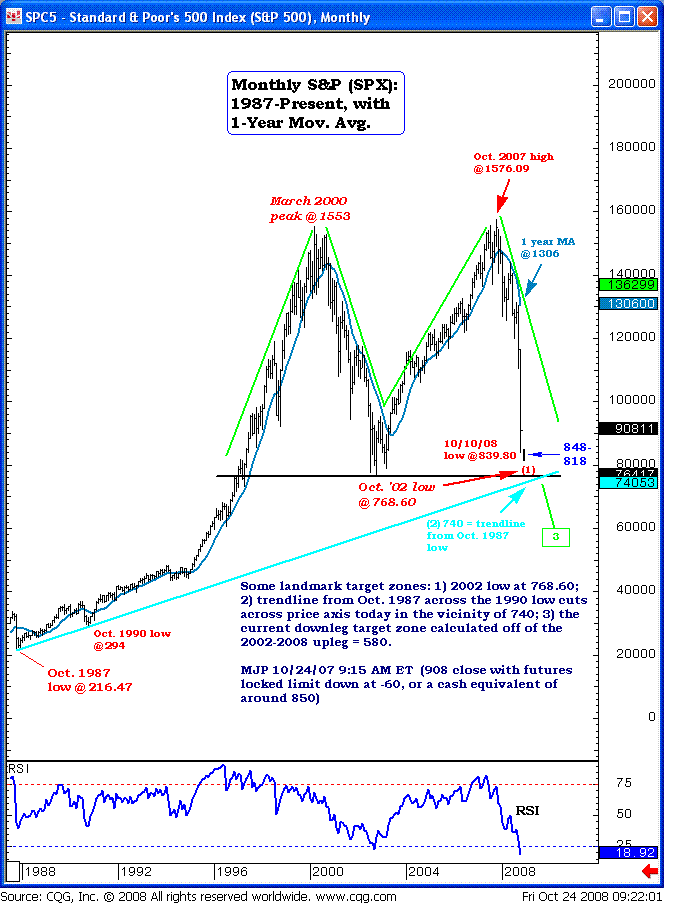
Reviewing the monthly chart on the S&P 500, some landmark target zones are 1) the 2002 low at 768.60; 2) the trendline from October 1987 across the 1990 low, which cuts across the price axis in the vicinity of 740; and 3) the current downleg target zone calculated off of the 2002-09 upleg, which equalsŠ580!

Sign up for a free 15-day trial to Mike's ETF Trading Diary today.
By Mike Paulenoff
Mike Paulenoff is author of the MPTrader.com (www.mptrader.com) , a real-time diary of Mike Paulenoff's trading ideas and technical chart analysis of Exchange Traded Funds (ETFs) that track equity indices, metals, energy commodities, currencies, Treasuries, and other markets. It is for traders with a 3-30 day time horizon, who use the service for guidance on both specific trades as well as general market direction
© 2002-2008 MPTrader.com, an AdviceTrade publication. All rights reserved. Any publication, distribution, retransmission or reproduction of information or data contained on this Web site without written consent from MPTrader is prohibited. See our disclaimer.
Mike Paulenoff Archive |
© 2005-2022 http://www.MarketOracle.co.uk - The Market Oracle is a FREE Daily Financial Markets Analysis & Forecasting online publication.


