


Stock Market Historical Trends Suggest A Strengthening Bullish Trend In December
Stock-Markets / Stock Market 2021 Nov 30, 2021 - 02:19 PM GMTBy: Chris_Vermeulen

I received many messages and emails asking my opinions related to the recent market volatility and sideways trending in the US markets. Many traders see the recent downward price trend as a warning of a potential shift in trends. Yet, I see it as normal November volatility in price and wanted to share some data to support my conclusions.
Even though I’m not dismissing some external event, like a sudden US Fed move or some foreign market event, historically, the US markets enter a reasonably strong Christmas/Santa rally phase at this time every year. The increasing volatility usually starts to build in September/October – reaching a peak in October/November every year. December’s trends are traditionally much more muted and consolidated.
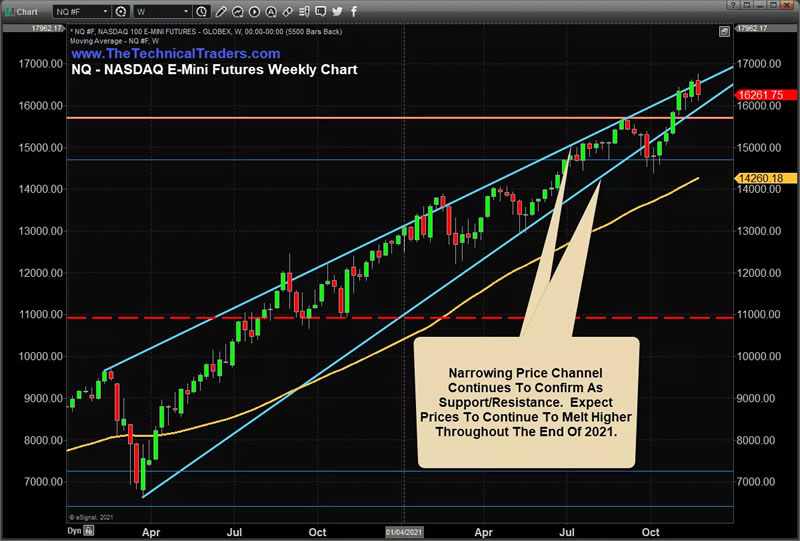
NASDAQ Trending In Narrowing Upward Price Channel
The NASDAQ continues to trend in a narrowing price channel created by the COVID and post-COVID rotation/rally. Recently, we’ve seen the biggest volatility breakdown in price take place last August/September. Once October started, the NASDAQ began another rally phase that carried into November.
As November comes to a close, I expect a moderate rally to continue melting price higher that will likely carry into December 2021.
Historical Price Data Paints A Very Clear Picture For Traders
I’ve pulled together some data using my proprietary price modeling and data mining utility to illustrate these trends more clearly. I’ve pulled data from the QQQ and the SPY to help readers understand what to expect as we move closer to closing out 2021.
Overall, November is usually a moderately volatile month in the markets. I’m providing data from a proprietary data mining tool I use that helps me understand historical volatility and price trends throughout various months and seasons. Allow me to explain this data so you can learn to pull more subtle inferences from it – as I do.
Be sure to sign up for our free market trend analysis and signals now so you don’t miss our next special report!
First, the Largest Monthly POS/NEG (Positive/Negative) ranges show us volatility ranges and general price trending capabilities. The span between the POS and NEG values reflects volatility for any given month. For that month, the strength, or Trend Bias, should be evident by looking for the largest POS or largest NEG value.
Second, the Total Monthly POS/NEG values reflect how data was distributed and the associated volatility related to each side of price trends. Larger POS ranges show greater volatility to the upside. Larger NEG ranges show greater volatility to the downside. Additionally, pay attention to the distribution across the total number of months for each POS or NEG Monthly Totals. These show how dominant trending is or is not.
Last, the Total Monthly Sum values provide some general guidance regarding the strength of trending and momentum likely within each month. Total Sum values that are larger than the POS/NEG values indicate stronger momentum trends within each monthly period.
I’ve broken this data into QQQ and SPY blocks to see how the data differs between these two US major indexes.
QQQ Historical Price Data Mining Results
The QQQ data consists of 23 years of monthly historical data. Allow me to try to share my analysis of this data with you.
- September is generally quite volatile with a predominance of downward price trending overall. In fact, the considerable Total Monthly Sum value shows September can show strong downside price trends closing out the month. September showed 12 NEG months and 11 POS months, so September is basically 50/50 in terms of trend direction – leaning slightly heavier towards downward trending.
- October reflects even bigger volatility and usually closes higher to represent a moderate recovery from September. October’s Total Monthly bars show 15 POS and 8 NEG – showing solid bullish trending potential.
- November shows the biggest historical volatility and usually closes moderately higher overall. This is usually when the Christmas Rally begins – where traders expect strong end-of-year bullish trending. November’s Total Monthly bars show 17 POS and 6 NEG – showing very strong bullish trending potential.
- December reflects more mild volatility with continued bullish trending. The POS/NEG values range is much smaller than October & November – yet still larger than September. The smaller Total Sum value suggests trending is a bit more muted on average but still generally bullish. December’s Total Monthly bars show 11 POS and 1 NEG – showing another 50/50 trending potential, leaning slightly bullish.
| QQQ Monthly Market Historical Data |
| ===[ September ]=================================== – Largest Monthly POS : 5.61 NEG -21.99 – Total Monthly NEG : -78.53 across 12 bars – Avg = -6.54 – Total Monthly POS : 21.69 across 11 bars – Avg = 1.97 ——————————————– – Total Monthly Sum : -56.84 across 23 bars Analysis for the month = 9 ===[ October ]===================================== – Largest Monthly POS : 28.15 NEG -15.96 – Total Monthly NEG : -44.66 across 8 bars – Avg = -5.58 – Total Monthly POS : 94.16 across 15 bars – Avg = 6.28 ——————————————– – Total Monthly Sum : 49.49 across 23 bars Analysis for the month = 10 ===[ November ]==================================== – Largest Monthly POS : 30.24 NEG -18.71 – Total Monthly NEG : -28.313 across 6 bars – Avg = -4.72 – Total Monthly POS : 86.374 across 17 bars – Avg = 5.08 ——————————————– – Total Monthly Sum : 58.06 across 23 bars Analysis for the month = 11 ===[ December ]==================================== – Largest Monthly POS : 17.37 NEG -15.11 – Total Monthly NEG : -31.75 across 11 bars – Avg = -2.89 – Total Monthly POS : 49.88 across 11 bars – Avg = 4.53 ——————————————– – Total Monthly Sum : 18.12 across 22 bars Analysis for the month = 12 =============================================== |
SPY Historical Data Mining Results
The SPY data consists of 29 years of monthly historical data. Let’s take a look at how the SPY compares to the QQQ…
- September is generally moderately volatile with a predominance of downward price trending overall. The large Total Monthly Sum value shows September can reflect strong downside price trends closing out the month. September showed 15 NEG months and 14 POS months, so September is basically 50/50 in terms of trend direction – leaning slightly heavier towards downward trending.
- October volatility increases more than 40% compared to September for the SPY. The SPY usually recovers almost all of the September losses in October. Notice the range of the POS/NEG values in October reflect a more consistent range than the Total Monthly Sum in comparison to September or November? This suggests that October usually presents a stronger momentum trend – usually closing higher for October. October’s Total Monthly bars show 19 POS and 10 NEG – showing very strong bullish trending potential.
- November shows strong historical volatility, almost on-par with October, and usually closes strongly higher overall. The 114.52 Total Monthly Sum suggests the SPY can really “take off” in November at times. Also, the lower value shown in the NEG value suggests downside price pressure is minimized in November. October’s Total Monthly bars show 23 POS and 6 NEG – showing extremely strong bullish trending potential.
- December clearly illustrates a general slowdown in momentum for the SPY. The POS and NEG values range is much smaller than the October/November ranges, and the bias between these numbers is NEGATIVE. That suggests that downside price volatility may be a bit stronger in December – prompting some moderate downside price trends.
Overall, the Total Monthly Sum shows December usually closes higher, though. Continuing the Christmas Rally into the end of the year is very common for the US markets. December’s Total Monthly bars show 19 POS and 9 NEG – showing very strong bullish trending potential.
| SPY Monthly Market Historical Data |
| ===[ September ]=================================== – Largest Monthly POS : 8.81 NEG -22.42 – Total Monthly NEG : -104.85 across 14 bars – Avg = -7.49 – Total Monthly POS : 51.75 across 15 bars – Avg = 3.45 ——————————————– – Total Monthly Sum : -53.09 across 29 bars Analysis for the month = 9 ===[ October ]===================================== – Largest Monthly POS : 30.11 NEG -20.09 – Total Monthly NEG : -62.06 across 10 bars – Avg = -6.21 – Total Monthly POS : 130.11 across 19 bars – Avg = 6.85 ——————————————– – Total Monthly Sum : 68.05 across 29 bars Analysis for the month = 10 ====[ November ]=================================== – Largest Monthly POS : 35.51 NEG -10.67 – Total Monthly NEG : -26.30 across 6 bars – Avg = -4.38 – Total Monthly POS : 140.83 across 23 bars – Avg = 6.12 ——————————————– – Total Monthly Sum : 114.52 across 29 bars Analysis for the month = 11 ===[ December ]==================================== – Largest Monthly POS : 11.81 NEG -25.72 – Total Monthly NEG : -44.60 across 9 bars – Avg = -4.96 – Total Monthly POS : 63.82 across 19 bars – Avg = 3.36 ——————————————– – Total Monthly Sum : 19.21 across 28 bars Analysis for the month = 12 =============================================== |
December’s Santa Rally Should Become Evident Within 5 to 10 Days
December 2021 should see a solid melt-up in trending unless something happens to disrupt these general historical trends. I expect the markets to settle into early December and to start trending higher in a moderate “melt-up” type of trend – likely moving in () 0.3% to 1.3% daily ranges. Meaning the QQQ and SPY may rally between 3.5% to 5.5% higher before the end of 2021 if my estimates are accurate.
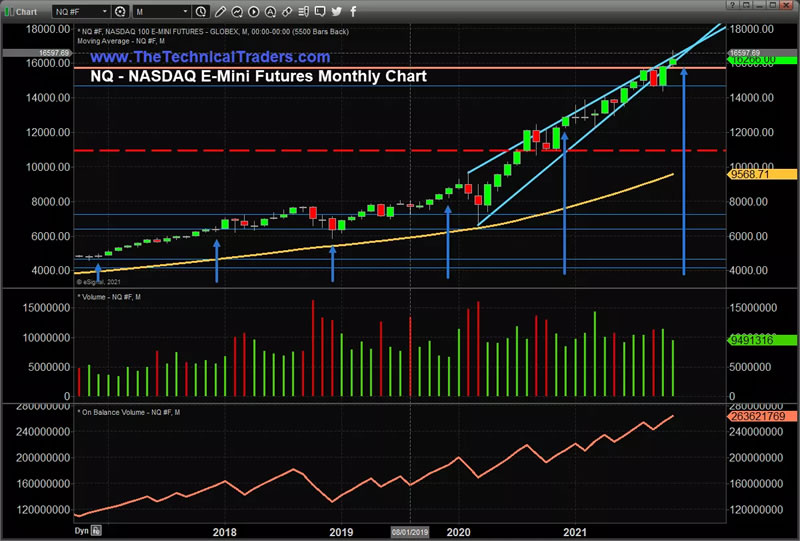
Traders should start to see a solid price rally form in the QQQ and SPY over the next 5 to 10 trading days. My expectations are a reasonably early start to bullish prices trending in early December. The NASDAQ could target $17,000 or higher, while the SPY may target $495 to $500 before the end of 2021.
The strongest sectors are likely to be Technology, Consumer Staples, Retail, Real Estate, and Financials.
This rally may carry into, and possibly through, January 2021 and beyond. Stay ahead of these significant trends by following our research.
Near the end of December, I’ll publish a follow-up article to this one highlighting what to expect in January, February, and March 2022. Stay tuned for more data mining research and guidance.
Want to Learn More About Historical Trends and POS/NEG Ranges?
Follow my research and learn how I use specific tools to help me understand price cycles, set-ups, and price target levels. Over the next 12 to 24+ months, I expect very large price swings in the US stock market and other asset classes across the globe. I believe the markets are starting to transition away from the continued central bank support rally phase and may start a revaluation phase as global traders attempt to identify the next big trends. Precious Metals will likely start to act as a proper hedge as caution and concern start to drive traders/investors into Metals.
Kindly take a minute to learn about my Total ETF Portfolio (TEP) and how it can help you identify and trade better sector setups. My team and I have built these strategies to help us identify the strongest and best trade setups in any market sector. Every day, we deliver these setups to our subscribers along with the TEP ETF sectors system trades. You owe it yourself to see how simple it is to trade 30% to 40% of the time to generate incredible results.
Chris Vermeulen
www.TheTechnicalTraders.com
Chris Vermeulen has been involved in the markets since 1997 and is the founder of Technical Traders Ltd. He is an internationally recognized technical analyst, trader, and is the author of the book: 7 Steps to Win With Logic
Through years of research, trading and helping individual traders around the world. He learned that many traders have great trading ideas, but they lack one thing, they struggle to execute trades in a systematic way for consistent results. Chris helps educate traders with a three-hour video course that can change your trading results for the better.
His mission is to help his clients boost their trading performance while reducing market exposure and portfolio volatility.
He is a regular speaker on HoweStreet.com, and the FinancialSurvivorNetwork radio shows. Chris was also featured on the cover of AmalgaTrader Magazine, and contributes articles to several leading financial hubs like MarketOracle.co.uk
Disclaimer: Nothing in this report should be construed as a solicitation to buy or sell any securities mentioned. Technical Traders Ltd., its owners and the author of this report are not registered broker-dealers or financial advisors. Before investing in any securities, you should consult with your financial advisor and a registered broker-dealer. Never make an investment based solely on what you read in an online or printed report, including this report, especially if the investment involves a small, thinly-traded company that isn’t well known. Technical Traders Ltd. and the author of this report has been paid by Cardiff Energy Corp. In addition, the author owns shares of Cardiff Energy Corp. and would also benefit from volume and price appreciation of its stock. The information provided here within should not be construed as a financial analysis but rather as an advertisement. The author’s views and opinions regarding the companies featured in reports are his own views and are based on information that he has researched independently and has received, which the author assumes to be reliable. Technical Traders Ltd. and the author of this report do not guarantee the accuracy, completeness, or usefulness of any content of this report, nor its fitness for any particular purpose. Lastly, the author does not guarantee that any of the companies mentioned in the reports will perform as expected, and any comparisons made to other companies may not be valid or come into effect.
Chris Vermeulen Archive |
© 2005-2022 http://www.MarketOracle.co.uk - The Market Oracle is a FREE Daily Financial Markets Analysis & Forecasting online publication.