


Cannabis ETF MJ Basing & Volatility Patterns
Commodities / Cannabis Nov 22, 2021 - 03:55 PM GMTBy: Chris_Vermeulen

Recently, the Cannabis sector has shown signs of increased volume, volatility, and a reasonably strong potential for a price base. Volume started increasing near mid-September as the price of MJ fell below $15. This support level originated from late December 2020 after a significant rally trend from recent lows near $10 – when the Reddit retail trader event started to unfold.
I wrote about this sector and these opportunities in many articles before the incredible rally in late 2020 into 2021.
- January 3, 2021: 2021 MAY BE A GOOD YEAR FOR THE CANNABIS/MARIJUANA
- January 11, 2021: REVISITING OUR OCTOBER 23 FOUR STOCKS TO OWN ARTICLE – PART I
- February 14, 2021: CANNABIS, ALTERNATIVE AGRA, MUSHROOMS, AND CRYPTOS – EVERYTHING ALT IS HOT – PART I
What I find interesting are two things. First, the recently proposed cannabis reform legislation may prompt a nationwide declassification of marijuana as a class-3 drug. This change could open every state, consumer, industry, and banking/financial institution to kick the doors wide to participate in the cannabis industry. Secondly, this industry is well past the initial stages of growth and attrition from many years ago. Now, established players and proven markets are competing for market share. This creates a very competitive and dynamic environment in this sector.
What I believe can happen over the next 10+ years is a simple consolidation of the industry around centralized components of the cannabis market. And a renewed focus on federal approval and tracking related to “seed to consumer” regulations. My opinion is that the industry will see weaker players acquired by stronger players while startups still try to dominate the fringe market. These startups will likely be disruptors in the industry, just like independent brewers are popping up all over the US right now.
A Technical Look At cannabis etf MJ And The Pending January 2022 Apex
Technically, I see a very large Pennant/Flag formation on this Cannabis MJ chart. The formation leads me to believe early January could prompt a base or bottom near $13.25. I see the long-term support level, originating from the bottom in March 2020, as a very critical price level. This support level will likely prompt the current price to try and hold above $12.75~$13.00 as the final waves of the Pennant/Flag trend unfold.
If my wave count is correct, the price will attempt to bottom near $12.75~$13.00 soon. After this, the Cannabis MJ price will try to rally up to $15.25 to $15.75 before the end of 2021. A final downward price wave may push the price below the $13.00 level again as volatility becomes more elevated near the Apex of the Pennant/Flag formation. The Apex takes place near the end of January 2022. Therefore, traders should consider looking for buying opportunities near or below current support (somewhere near or below $12.75 to $13.00).
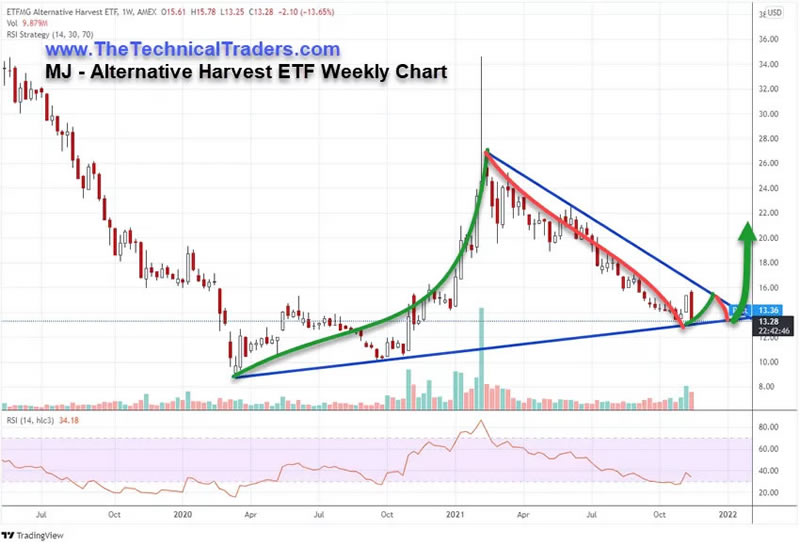
The Cannabis MJ chart shows price is attempting to confirm the lower support channel. If this lower support channel fails, we would wait for a new price trend to establish a new price pattern – hopefully providing better future guidance. Currently, this extended Pennant/Flag price formation appears to be trending and confirming nicely.
My belief is MJ will start at Apex near the end of January 2022. Meaning we should expect bigger price volatility and the potential for a “blow-off” price rotation sometime after January 15, 2022. Most Apex setups result in a type of wild rotation in price that I call a “blow-off” price rotation. Ideally, traders want to ride out the “blow-off” rotation and try to catch the breakout or break-away trend when it starts.
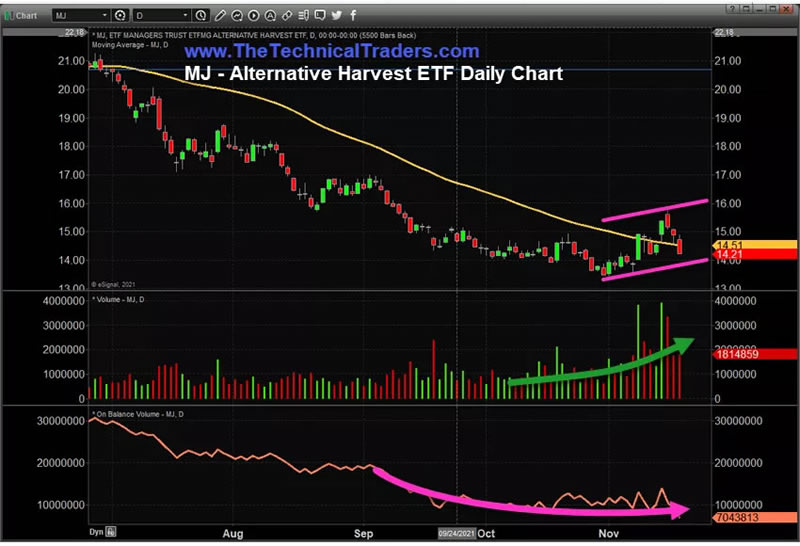
Daily MJ Chart Shows Clear Price Trending In Support Of The Lower Price Channel
This Daily MJ Chart highlights an upward price channel recently set up after price retested the $13.00 lower support level. If you understand the five waves of a Pennant/Flag formation, you’ll quickly understand there are two immediate potential outcomes for the price right now. First, the price could fail to stay within this channel and break downward – retesting the $13 lower support channel again (or possibly trend a bit lower). Second, the price could have already confirmed the $13 lower support channel and is in the process of moving higher – targeting the $15.25 to $15.75 level.
We are seeing some basing/bottoming in On Balanced Volume and a very large increase in the Daily trading volume recently. Both of these indicate traders are accumulating shares of MJ in preparation for a price move.
With pending cannabis reform legislation and President Biden likely to support this new economic frontier, any federal decriminalization of cannabis would potentially prompt a wave of buying within this sector. Given the current Pennant/Flag formation in MJ, traders may be already looking for opportunities in the cannabis sector. MJ could rally back above $20 to $21 fairly quickly.
Be patient, though, as this Pennant/Flag formation won’t be complete until sometime after January 10th to 14th. Plan how you expect the markets to trend throughout the end of this year. Watch how MJ reacts to the final three price waves of the Pennant/Flag formation. As we approach early 2022, the cannabis sector could become a leading one if the new cannabis reform legislation gets closer to becoming law. We may see another rally, like in early 2021. We may see MJ rally well above $25 if traders start chasing a breakout trend.
WANT TO LEARN MORE ABOUT MARKET TRENDS?
Follow my research and learn how I use specific tools to help me understand price cycles, setups, and price target levels. Over the next 12 to 24+ months, I expect large price swings in the US stock market and other asset classes across the globe. I believe the markets are starting to transition away from the continued central bank support rally phase. Next, a revaluation phase may begin as global traders attempt to identify emerging trends. Precious Metals will likely start to act as a proper hedge as caution and concern drive traders/investors into Metals.
Please take a minute to visit www.TheTechnicalTraders.com to learn about our Total ETF Portfolio (TEP) technology and it can help you identify and trade better sector setups. We’ve built this technology to help us identify the strongest and best trade setups in any market sector. Every day, we deliver these setups to our subscribers along with the TEP system trades. You owe it to yourself to see how simple it is to trade 30% to 40% of the time to generate incredible results.
Have a great day!
Chris Vermeulen
www.TheTechnicalTraders.com
Chris Vermeulen has been involved in the markets since 1997 and is the founder of Technical Traders Ltd. He is an internationally recognized technical analyst, trader, and is the author of the book: 7 Steps to Win With Logic
Through years of research, trading and helping individual traders around the world. He learned that many traders have great trading ideas, but they lack one thing, they struggle to execute trades in a systematic way for consistent results. Chris helps educate traders with a three-hour video course that can change your trading results for the better.
His mission is to help his clients boost their trading performance while reducing market exposure and portfolio volatility.
He is a regular speaker on HoweStreet.com, and the FinancialSurvivorNetwork radio shows. Chris was also featured on the cover of AmalgaTrader Magazine, and contributes articles to several leading financial hubs like MarketOracle.co.uk
Disclaimer: Nothing in this report should be construed as a solicitation to buy or sell any securities mentioned. Technical Traders Ltd., its owners and the author of this report are not registered broker-dealers or financial advisors. Before investing in any securities, you should consult with your financial advisor and a registered broker-dealer. Never make an investment based solely on what you read in an online or printed report, including this report, especially if the investment involves a small, thinly-traded company that isn’t well known. Technical Traders Ltd. and the author of this report has been paid by Cardiff Energy Corp. In addition, the author owns shares of Cardiff Energy Corp. and would also benefit from volume and price appreciation of its stock. The information provided here within should not be construed as a financial analysis but rather as an advertisement. The author’s views and opinions regarding the companies featured in reports are his own views and are based on information that he has researched independently and has received, which the author assumes to be reliable. Technical Traders Ltd. and the author of this report do not guarantee the accuracy, completeness, or usefulness of any content of this report, nor its fitness for any particular purpose. Lastly, the author does not guarantee that any of the companies mentioned in the reports will perform as expected, and any comparisons made to other companies may not be valid or come into effect.
Chris Vermeulen Archive |
© 2005-2022 http://www.MarketOracle.co.uk - The Market Oracle is a FREE Daily Financial Markets Analysis & Forecasting online publication.