Has Zillow’s Collapse Signaled A Warning For The Capital Markets?
Stock-Markets / Financial Markets 2021 Oct 26, 2021 - 09:00 PM GMTBy: Chris_Vermeulen
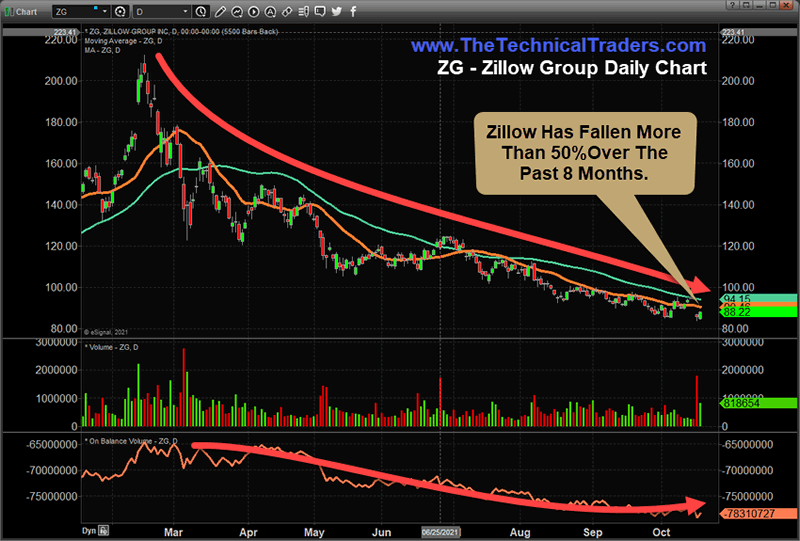
Watching Zillow (ZG) move from over $200 per share to recent levels below $90, reflecting a more than 55% collapse in price, while the housing market continues to rally may be an indication that traders/investors have already discounted the future peak in the US capital markets and Real Estate assets related to the current market environment. Zillow is not the only symbol experiencing this broad price decline. Redfin (RDFN) has also declined more than 54% over the past 7+ months.
Is The Peak In Real Estate Flippers Prices Sending A Strong Warning For Traders/Investors?
The peak in these stocks happened near February 16~22, 2021. This date, interestingly enough, aligns with a peak in global capital markets using my proprietary Smart Cash Index and a very clear peak in the Chinese Hang Seng Index.
Recent news that Zillow halted the purchases of homes using its “Zestimate” and Ibuyer programs, which act as a purchase, renovate, flip-type of market service allowing home sellers to get an almost instant purchase offer from Zillow has raised questions in my mind related to the potential risks involved in owning large quantities of real estate assets in a shifting market (source: https://finance.yahoo.com/news/why-zillow-had-stop-buying-170414137.html).
This news article suggests Zillow has over 2800 US homes available for sale. We are not aware of how many homes have been purchased and are waiting for completed repairs/inspections before they go on the market.
Be sure to sign up for our free market trend analysis and signals now so you don’t miss our next special report!
This article also suggests other flipping companies are still actively engaging in this risky activity. Opendoor peaked at share price near the same February dates this year but has continued to acquire and flip more homes than Zillow over the past 5+ years. Redfin, yet another flipper company, also continues to engage in buying, renovating, and flipping real estate in hot US markets.
My thinking is the rally in Real Estate prices, in some cases, more than 35%, which started near the end of 2020 and carried into the first two quarters of 2021 may have prompted a very risky race to acquire and flip hot market real estate at a time when labor shortages and commodity price rallies pushed the costs of “flipping” even higher may have put extended pressures on these firms to “flip for profits”.
October 7, 2021: REAL ESTATE ETFS REACT TO RISING MORTGAGE RATES – PART II
Then add into this mix the Chinese/Asian Real Estate market concerns and the potential that Chinese/foreign market buyers may have moved away from the super-heated US Real Estate market recently while US consumers are starting waiting for the US Fed to potentially raise interest rates and we have a very interesting storm on the horizon.
These Flipper firms are holding large quantities of Real Estate assets where their purchase price likely reflects the dramatic increases in selling prices over the past 15+ months and is further complicated by supply-side costs for raw materials, labor, and equipment to complete the refurnished property while consumers may be starting to shift away from the “buy it at any cost” type of mentality.
Could the collapse in Zillow, Redfin, and OpenDoor reflect the underlying risks of an overly aggressive buying/flipping algorithm event?
Zillow Daily Chart Clearly Reflects Investor Sentiment Compared To US Major Indexes
This Daily Zillow Group chart clearly shows the extended price decline that has taken place over the past 7+ months. What is interesting is that the US major indexes continue to push higher and Real Estate prices continue to push higher while traders/investors are obviously not sharing the same bullish enthusiasm in Zillow, Redfin, and Opendoor.
A price collapse of over 50% is a big downside price trend for these types of companies. Consider the fact that they are buying thousands of homes across the US, which likely suggests they are taking on close to a $500m to $1b+ in assets/risk while attempting to quickly flip these properties for moderate profits. In a hot Real Estate market with strong buyer activity, one would think owning these hot assets would push traders/investors to believe “future profits are almost certain”. Yet that is clearly not the case on this chart.

Could it be that traders/investors are more keenly aware of the extended risks related to a potential US/global housing market bubble and the underlying liabilities related to a more extended downturn in this sector? Obviously, traders/investors have not been super excited about future potential profits for these firms recently. Maybe something will change in the near future? If not, this downward price trend suggests traders believe the risks outweigh the potential gains.
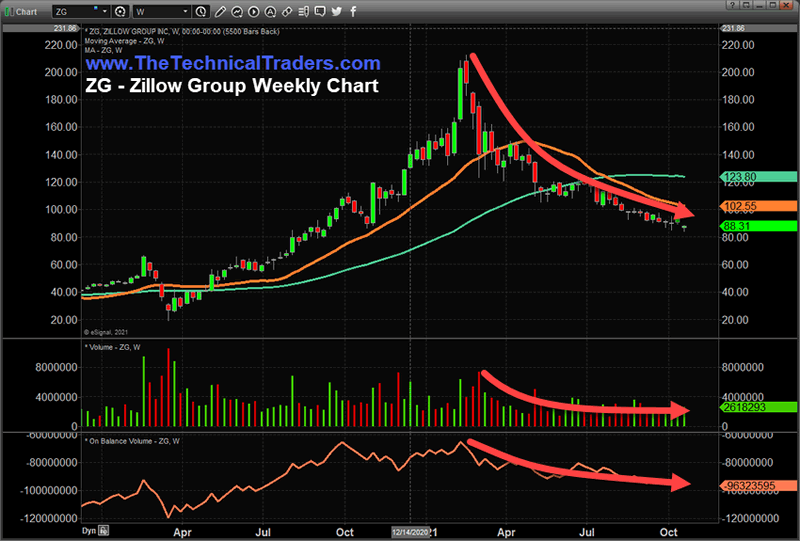
This Weekly Zillow chart shows how quickly the price trend reversed direction in February 2021. Remember, this date also aligned with a peak in the Chinese Hang Seng Index and likely represented a broad shift in investor sentiment as dynamics suddenly changed in the global Real Estate sector.
Still, the price of Zillow Group shares is trading near $90 – more than 400% higher than the COVID low price levels and more than 200% more than the pre-COVID average price level.
Are these price declines a warning that the Real Estate market/sector has shifted away from the active “flipper” mode and transitioned into more conservative expectations?

In Part II of this article, I’ll explore more detailed market analysis and trends related to the Real Estate market and price dynamics.
After these extended downtrends in price levels for these Real Estate/Flipper firms, it seems likely that some type of base/bottom will likely set up, which may prompt a new rally phase or a breakdown below this base/bottom level. I believe these trends reflect broad market concerns related to the super-heated Real Estate market over the past 15+ months. In short, I believe this extended price decline highlights inherent risks related to the type of investments and potential returns on those investments. Traders should cautiously watch how this trend plays out over the next few months.
Over the next 12 to 24+ months, I expect very large price swings in the US stock market and other asset classes across the globe. I believe the markets are starting to transition away from the continued central bank support rally phase and may start a revaluation phase as global traders attempt to identify the next big trends. Precious Metals will likely start to act as a proper hedge as caution and concern start to drive traders/investors into Metals.
Please take a minute to visit www.TheTechnicalTraders.com to learn about our Total ETF Portfolio (TEP) technology and it can help you identify and trade better sector setups. We’ve built this technology to help us identify the strongest and best trade setups in any market sector. Every day, we deliver these setups to our subscribers along with the TEP system trades. You owe it to yourself to see how simple it is to trade 30% to 40% of the time to generate incredible results.
Have a great day!
Chris Vermeulen
www.TheTechnicalTraders.com
Chris Vermeulen has been involved in the markets since 1997 and is the founder of Technical Traders Ltd. He is an internationally recognized technical analyst, trader, and is the author of the book: 7 Steps to Win With Logic
Through years of research, trading and helping individual traders around the world. He learned that many traders have great trading ideas, but they lack one thing, they struggle to execute trades in a systematic way for consistent results. Chris helps educate traders with a three-hour video course that can change your trading results for the better.
His mission is to help his clients boost their trading performance while reducing market exposure and portfolio volatility.
He is a regular speaker on HoweStreet.com, and the FinancialSurvivorNetwork radio shows. Chris was also featured on the cover of AmalgaTrader Magazine, and contributes articles to several leading financial hubs like MarketOracle.co.uk
Disclaimer: Nothing in this report should be construed as a solicitation to buy or sell any securities mentioned. Technical Traders Ltd., its owners and the author of this report are not registered broker-dealers or financial advisors. Before investing in any securities, you should consult with your financial advisor and a registered broker-dealer. Never make an investment based solely on what you read in an online or printed report, including this report, especially if the investment involves a small, thinly-traded company that isn’t well known. Technical Traders Ltd. and the author of this report has been paid by Cardiff Energy Corp. In addition, the author owns shares of Cardiff Energy Corp. and would also benefit from volume and price appreciation of its stock. The information provided here within should not be construed as a financial analysis but rather as an advertisement. The author’s views and opinions regarding the companies featured in reports are his own views and are based on information that he has researched independently and has received, which the author assumes to be reliable. Technical Traders Ltd. and the author of this report do not guarantee the accuracy, completeness, or usefulness of any content of this report, nor its fitness for any particular purpose. Lastly, the author does not guarantee that any of the companies mentioned in the reports will perform as expected, and any comparisons made to other companies may not be valid or come into effect.
Chris Vermeulen Archive |
© 2005-2022 http://www.MarketOracle.co.uk - The Market Oracle is a FREE Daily Financial Markets Analysis & Forecasting online publication.


