


Stock Market S&P500 Rallies Above $4400 – May Attempt To Advance To $4750~$4800
Stock-Markets / Stock Market 2021 Oct 24, 2021 - 10:44 PM GMTBy: Chris_Vermeulen

Two main factors are driving the rally in the US stock markets recently; retail traders buying the dip, and Q3:2021 earnings data is starting to shake away the concerns that resulted in the recent market rotation. Combine these activities with the start of the Christmas Rally phase (which usually starts sometime after mid/late-October and carries through into early January), and we have the making of a moderately strong potential price rally in the US major indexes over the next 60+ days.
The $4550 Level Is Critical Resistance For The S&P500
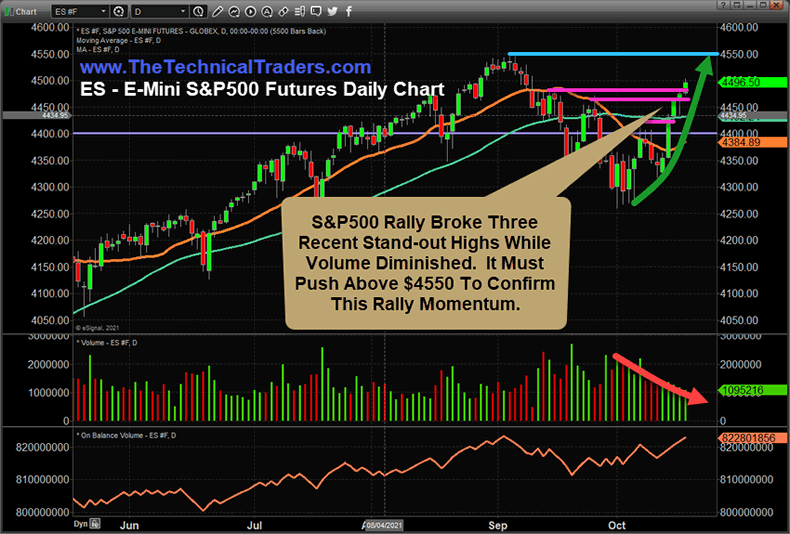
I’m highlighting this ES Daily & Weekly chart pattern, below, to share with you how important it is to see the ES break above the $4550 level – the past high price peak. If the markets are going to start a new rally headed into the 2021 Christmas season, then we need to see the ES continue to rally and break above the $4550 level. It is critically important that price breach the $4550 level and attempt a strong move higher if this bullish momentum persists.
The ES has already broken above three previous Stand-out Highs, drawn in MAGENTA. This shows the strength of a bullish price advance and building bullish price momentum. Yet, the final price high, near $4550, is critically important from a technical standpoint.
If the price fails to breach above the $4550 level, a Double-Top, or Right-Shoulder type of price pattern will be set. This could indicate a failure in price momentum and may suggest the price will continue to consolidate further. A more confident rally above the $4550 level will indicate buying momentum is not concerned with this previous price peak level.
S&P500 May Rally 7% To 11% Or More After Breaking Above $4550
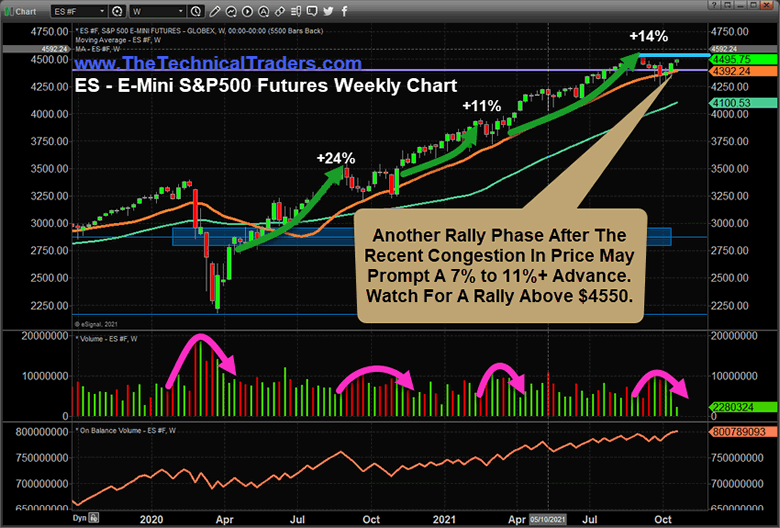
This Weekly ES (S&P500) Chart highlights the multiple periods of price congestion which also prompted large volume spikes as traders moved capital away from perceived risks. After the price consolidation ended, traders pushed prices higher while volume stayed moderately diminished overall. Each new advance in price prompted a substantial price rally.
If this same type of Price/Volume setup happens after the current deeper downside price rotation, then we may see a new rally in the ES which could target $4750~4800 – a full 11~12%+ above the recent lows near $4300.
The critical resistance level near $4550 holds the key to when and if the ES is able to advance further and push the Christmas Rally into existence or if the price will fail to breach the $4550 level and continue to consolidate and rotate for longer.
Traders should prepare for the potential of a strong breakout price rally as the price continues to attempt to move higher while watching the key $4550 resistance level. I would expect the price may possibly stall as it attempts to move closer to the $4550 level – so be prepared for some additional volatility. If price rallies through the $4550 level quickly, then we may see a very strong Christmas Rally start to set up for the US markets – possibly rallying beyond my $4750~$4800 initial targets.
Please take a minute to visit www.TheTechnicalTraders.com to learn about our Total ETF Portfolio (TEP) technology and it can help you identify and trade better sector setups. We’ve built this technology to help us identify the strongest and best trade setups in any market sector. Every day, we deliver these setups to our subscribers along with the TEP system trades. You owe it to yourself to see how simple it is to trade 30% to 40% of the time to generate incredible results.
Have a great day!
Chris Vermeulen
www.TheTechnicalTraders.com
Chris Vermeulen has been involved in the markets since 1997 and is the founder of Technical Traders Ltd. He is an internationally recognized technical analyst, trader, and is the author of the book: 7 Steps to Win With Logic
Through years of research, trading and helping individual traders around the world. He learned that many traders have great trading ideas, but they lack one thing, they struggle to execute trades in a systematic way for consistent results. Chris helps educate traders with a three-hour video course that can change your trading results for the better.
His mission is to help his clients boost their trading performance while reducing market exposure and portfolio volatility.
He is a regular speaker on HoweStreet.com, and the FinancialSurvivorNetwork radio shows. Chris was also featured on the cover of AmalgaTrader Magazine, and contributes articles to several leading financial hubs like MarketOracle.co.uk
Disclaimer: Nothing in this report should be construed as a solicitation to buy or sell any securities mentioned. Technical Traders Ltd., its owners and the author of this report are not registered broker-dealers or financial advisors. Before investing in any securities, you should consult with your financial advisor and a registered broker-dealer. Never make an investment based solely on what you read in an online or printed report, including this report, especially if the investment involves a small, thinly-traded company that isn’t well known. Technical Traders Ltd. and the author of this report has been paid by Cardiff Energy Corp. In addition, the author owns shares of Cardiff Energy Corp. and would also benefit from volume and price appreciation of its stock. The information provided here within should not be construed as a financial analysis but rather as an advertisement. The author’s views and opinions regarding the companies featured in reports are his own views and are based on information that he has researched independently and has received, which the author assumes to be reliable. Technical Traders Ltd. and the author of this report do not guarantee the accuracy, completeness, or usefulness of any content of this report, nor its fitness for any particular purpose. Lastly, the author does not guarantee that any of the companies mentioned in the reports will perform as expected, and any comparisons made to other companies may not be valid or come into effect.
Chris Vermeulen Archive |
© 2005-2022 http://www.MarketOracle.co.uk - The Market Oracle is a FREE Daily Financial Markets Analysis & Forecasting online publication.