Tech Stocks Bubble Valuations 2000 vs 2021
Stock-Markets / Tech Stocks Sep 25, 2021 - 09:52 PM GMTBy: Nadeem_Walayat
The US stock market has been content to rally to new highs with many stocks going to the Moon including most of our AI tech giants, a rally that I have been distributing into to the extent that I have now sold 80% of my holdings in the Top 6 AI stocks in my portfolio some of which I have been accumulating for over a decade (Microsoft). The primary objective of this analysis is the determine where we stand in terms of THE TOP, after all, all bull markets eventually do top either ending with a CRASH (1987) or a bear market (2000 and 2007). So what to hold and what to sell is the question I am asking myself, with a view to riding out a potential bear market / crash, where this analysis deploys a new automated metric of individual stock SELLING LEVELs so that one better knows where one stands in terms of ones portfolio, all in just one table. After all the risk we all fear is that of a 2000 style collapse that sends stocks lower for the next 20 years! Remember that bear market bottomed with a 85% collapse for tech stocks! Yes, one could say the likes of Amazon, Microsoft, Apple had become dirt cheap, but that would have been a very painful and prolonged discounting event. So a case of balancing the risks of letting some stocks ride whilst cashing in those that will pay a heavy price for their over exuberance all whilst being aware of the AI mega-trend trundling along in the background.
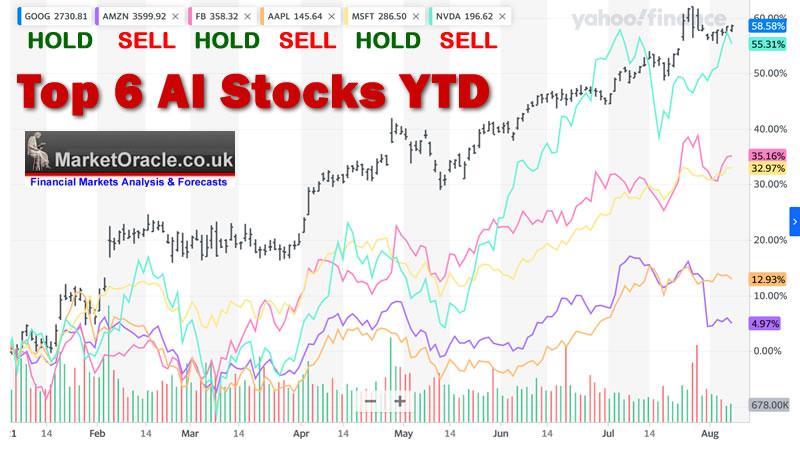
And we have the likes of AMD going to the MOON, yes in hindsight we can all wish we had bought more, I came close in Mid May to buying more but at that time was fully invested and thought it unwise to take on even more risk on. But I, and my patrons have had plenty of opportunities to buy AMD all the way from the March 2020 lows right up until my analysis of 10th of May at a price of $78 or better that AMD traded down to several times, so I will give AMD extra attention in this article.
AI Stocks Portfolio Buying and Selling Levels, Bubble Valuations 2000 vs 2021
Content:
- Stock Market Bubble Valuations 2000 vs 2021
- Microsoft to the Moon - OUCH!
- CISCO to the Moon - OUCH!
- INTEL to the Moon - OUCH!
- Tech Stocks in a Bubble today?
- China / US Stock Markets Divergence
- AI Stocks Portfolio Buying and SELLING Levels
- AI Stocks Portfolio Buy / Sell Table Update
- High Risk Stocks
- Market Oracle AI Coin Mothballed
- Global Warming Code RED
Stock Market Bubble Valuations 2000 vs 2021
How to quickly know if a stock is over valued or under valued\? Simply divide the annual earnings by the price and you get a trailing price / earnings ratio. Whilst far from being perfect hence why I have long since progressed to what I call the EC Ratio, a formulae used to better determine if a stock is Expensive or Cheap (EC) based on 15 metric that also includes the Price / Earnings ratio. Nevertheless I still use the P/E ratio when referring to stocks because I generate the EC ratio only for a handful of stocks. Maybe one day I will get around to writing a web application that automatically generates it for any stock and makes the results available to patrons.
So how do today's tech giant market cap stocks compare to those of March 2000 at the peak of the Nasdaq dot com bubble.
Firstly here is how the giant mega-trend corps of the dot com era have faired over the past 21 years.

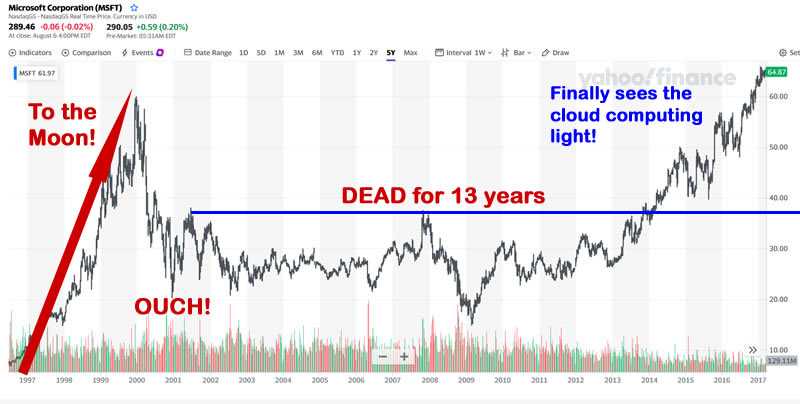
Microsoft's stock price in March 2000 was trading at $120 on a earnings multiple of 56 as the stock was in a race to become the worlds first $1 trillion market cap stock. Set this against today's price of $289 and multiple of 36, coupled with an EC score of 71. So whilst Microsoft today is not exactly cheap neither has it reached its 2000 bubble valuation, for that Microsoft would be trading at $450! And before one considers holders having been invested in winner that survived the dot com crash, bear in mind the following chart which shows that Microsoft (allowing for stock splits) would only have cleared its Dot com high during 2017! That is 17 YEARS! And during that time one would have seen the value of ones investment fall to a low of 25% of the stocks high.
CISCO - The backbone of the then fast developing internet, much as Tesla is the backbone of the fast emerging EV and automated vehicles sector, with the likes of Google throwing tens of billions into AI and robotics each year. Everyone owned Cisco, just as everyone owns Google, Amazon, Apple or Facebook stock today.
Back In March 2000 Cisco was trading at a price of $146, on a PE of 120, to the moon, TO THE MOON! Where many were concerned Cisco WAS the Internet, one of the most valuable certification tracks of the time were those by Cisco, where even I was CCNA certified, desperately trying not to get further sucked into the highly costly Cisco certification tracks where CCNA gave way to CCNP to CCIE and beyond, the certifications were mushrooming into more OTT levels than what scientology has! CCNA OTTIV where after decades and several hundreds of thousands of dollars one would become one with the internet, be able to move data packets around with their mind! Other companies soon saw what a money spinner the certification tracks were and so the likes of Microsoft started their own such as Microsoft Office certifications, but I digress.
So what happened to the King of the Internet Cisco which according to many at the time was destined to go to the MOON!
Well even 21 years later Cisco has still not even recovered to the half way mark in market cap terms, even the share price trades below the March high of $146 splitted to $78, this despite extensive buy backs in recent years to try and drive the price higher to overcome that $78 brick wall!. The P/E ratio says it all as to why, where Cisco's current P/E of 23 is a far cry from 120 that it was trading at 21 years ago and thus sowed the seeds for what transpired since.
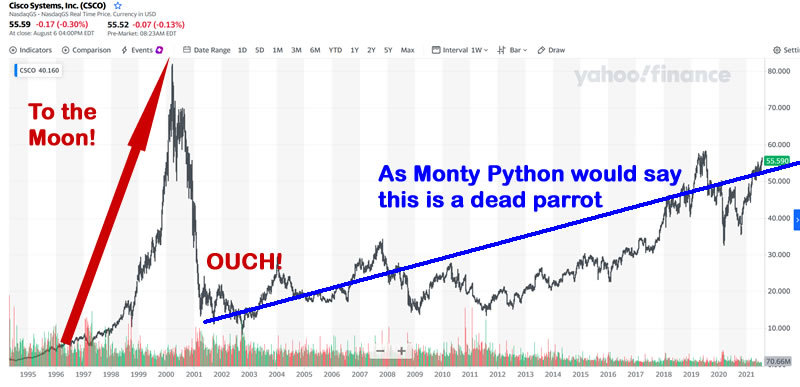
Imagine all those who either bought in the months before or after the dot com bubble top and decided to hang on have YET to break even! You have to understand that in March 2020 it was a done deal, Cisco was the Nvidia, was the Amazon, was the Apple of its time destined to become the worlds first $1 trillion stock! Whilst everyone recognised there were many over priced stocks but CISCO was BLUE CHIP! Cisco was going to OWN the future! GAME OVER as Cisco WAS the internet!
Just as many take today's multi trillion dollar corps as unassailable blue chips. And then we have the insane valuations of the likes of TESLA trading on a PE of 364! Understand this when the bubble bursts, Tesla's fate will be worse than any of the top 5 of 2000!
Digging further into the depths of internet history courtesy if Cisco's network hardware here's what one investment analyst (Paul Weinstein) working for First Boston said of Cisco in March 2020.
"We humbly submit that over the next two to three years, Cisco could be the first trillion dollar market cap company, and don't think they woudln;'t love it" As Weiensten put Cisco on a "Strong Buy" at virtually it's final HIGH! Three years later Cisco instead of doubling had collapsed to 1/10th it's March high!
INTEL's 2000 stock price high of $76 had the chip giant trading on an earnings multiple of 42, which is hardly exuberant in today's terms. Today Intel trades at $54 on a P/E of just 12. If intel was trading on par with that of its 2000 high then the stock price today would at $189. Which also suggests Intel has never managed to fully recover from the dot com bust mostly down to failure to innovate due to bad management, hence for a good 6 years was stuck at 7nm whilst tiny competitors such as AMD have grabbed CPU market share. In recent years every time Intel dips below $48 I tend to buy a little, who knows given it's low valuation a breakout above $76 may send Intel to the moon once more. And this is how the Intel stock price has faired over the past 21 years.
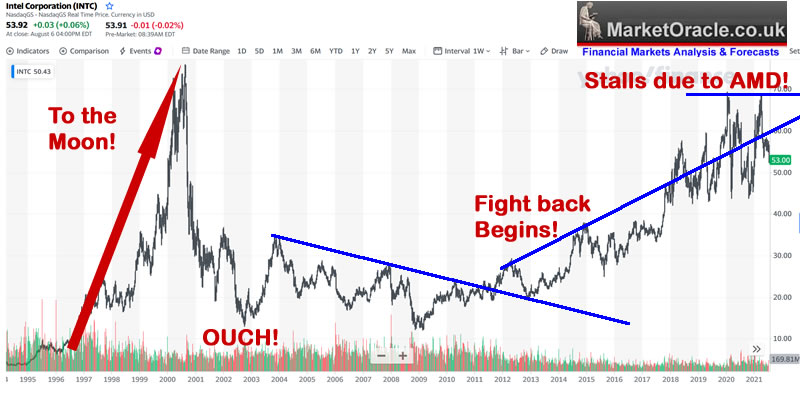
The EC ratio for Intel is just 10 which makes Intel in any era, bull or bear dirt cheap! Look even if AMD is crushing it like a bug, at an EC of 10 there really isn't much downside! Hence any dip is a buy op, even if upside is going to take several years of INNOVATION!
I think you get the picture, so I won't repeat the exercise for Oracle and IBM.
Tech Stocks in a Bubble today?
US GDP in 2000 was $10 trillion with Microsoft at 5.65% of US GDP, today's largest stock is Apple on a market cap $2.4 trillion which is 10.5% of US GDP of $22.7 trillion!
Yep sorry to burst your bubble but we are in a bubble!
And remember I am not looking at the loss making junk stocks of that age but the tech giants. Hence why I de-risked by selling out of Nvidia, Apple, Microsoft and Amazon. Whilst I will cling onto Google at 50% and Facebook at 30% as they are the best of the best.
Amazon to the MOON 2021! Then what?
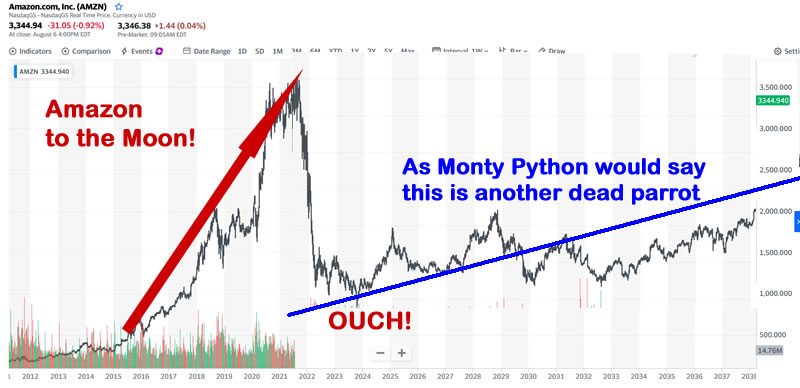
YES, Apple, Amazon, Facebook, Google and Nvidia all have highly compelling reasons for why they should all continue keep going to the MOON! But so did all of the tech giants in 2000!
And 20 years on only Microsoft eventually made it through to the other side to new all time highs. Imagine holding Intel in 2000, for which one had every reason to continue to hold, just as there is every reason to hold Google, Apple or Amazon today! And then look at what happened to the likes of Intel over the next 20 years! Where the stock price is STILL yet to trade to new highs! And this despite stock BUYBACKS!
As for Intel today, well it is where Microsoft was about 5 years ago when everyone thought it was game over for Microsoft just as everyone thinks its game over for Intel today given that AMD has won! BUT I am pretty confident that we will be seeing Intel in the not too distant future leaving it's sleeping giant status and doing it's own moon shot.
So I hope this acts as a wake up call for my Patrons who think investing is just a case of dollar cost averaging as one really does need mechanisms to disinvest from over valued stocks even though it is is extremely hard to do so, after all no one wanted to sell any of the tech giants in March 2000 given the amount of too the moon cool aid that was sloshing around at the time, but within a few short months many wish they had!
For instance, it was painful for me to hit the SELL button on Microsoft, a stock that I have been accumulating from when it was trading in the $20's! With my intention to buy back some day soon, but as what has happened to chinese stocks illustrates one just does not know what is around the corner that could trigger a collapse in stock prices by 50% or more to a level where most are then too afraid to buy.
So in a few months time we may be living in a completely different world where the likes of Microsoft, Amazon and Apple after a plunge in price have most investors who were happy to pile in at all time highs with their dollar cost averaging mantra are then too scared to either buy or sell as they watch in fear stock market armageddon take place all whilst the MSM, blogosFear and Youtubers reinforce their state of paralysis acting as echo chambers just regurgitating that which others have posted.
As for what I will be doing ? BUYING the PANIC! Even if I turn out to be early because during the mayhem most of the pieces of the puzzle will be unknown.
The rest of this extensive analysis AI Stocks Portfolio Buying and Selling Levels, Bubble Valuations 2000 vs 2021 was first been made available to Patrons who support my work. So for immediate first access to ALL of my analysis and trend forecasts then do consider becoming a Patron by supporting my work for $3 per month that is soon set to increase to $4 per month for new Patrons, so a short window of opportunity exists to lock in at $3 per month now before the price hike. https://www.patreon.com/Nadeem_Walayat.
Content:
- Stock Market Bubble Valuations 2000 vs 2021
- Microsoft to the Moon - OUCH!
- CISCO to the Moon - OUCH!
- INTEL to the Moon - OUCH!
- Tech Stocks in a Bubble today?
- China / US Stock Markets Divergence
- AI Stocks Portfolio Buying and SELLING Levels
- AI Stocks Portfolio Buy / Sell Table Update
- High Risk Stocks
- Market Oracle AI Coin Mothballed
- Global Warming Code RED
Including access to my most recent extensive analysis that maps out the stock markets trend into Mid 2022 which was first made available to Patrons who support my work - Stock Market FOMO Hits September Brick Wall - Dow Trend Forecast Sept 2021 to May 2022
Contents:
- Stock Market Forecast 2021 Review
- Stock Market AI mega-trend Big Picture
- US Economy and Stock Market Addicted to Deficit Spending
- US Economy Has Been in an Economic Depression Since 2008
- Inflation and the Crazy Crypto Markets
- Inflation Consequences for the Stock Market
- FED Balance Sheet
- Weakening Stock Market Breadth
- Why Most Stocks May Go Nowhere for the Next 10 Years!
- FANG Stocks
- Margin Debt
- Dow Short-term Trend Analysis
- Dow Annual Percent Change
- Dow Long-term Trend Analysis
- ELLIOTT WAVES Analysis
- Stocks and 10 Year Bond Yields
- SEASONAL ANALYSIS
- Short-term Seasonal Trend
- US Presidential Cycle
- Best Time of Year to Invest in Stocks
- 2021 - 2022 Seasonal Investing Pattern
- Formulating a Stock Market Trend Forecast
- Dow Stock Market Trend Forecast Sept 2021 to May 2022 Conclusion
- Investing fundamentals
- IBM Continuing to Revolutionise Computing
- AI Stocks Portfolio Current State
- My Late October Stocks Buying Plan
- HIGH RISK STOCKS - Invest and Forget!
- Afghanistan The Next Chinese Province, Australia Living on Borrowed Time
- CHINA! CHINA! CHINA!
- Evergrande China's Lehman's Moment
- Aukus Ruckus
So for immediate first access to ALL of my analysis and trend forecasts then do consider becoming a Patron by supporting my work for just $3 per month that is soon set to increase to $4 per month for new Patrons, so a short window of opportunity exists to lock in at $3 per month now before the price hike. https://www.patreon.com/Nadeem_Walayat.
Including access to .
Stock Market FOMO Going into Crash Season, Chinese Stocks and Bitcoin Trend Update
- FOMO Fumes on Negative Earnings
- Cathy Woods ARK Funds Performance Year to Date - Chinese Stocks Big Mistake
- INTEL The Two Steps Forward One Step Back Corporation
- AMD Ryzen 3D
- New Potential Addition to my AI Stocks Portfolio
- Why is Netflix a FAANG Stock?
- Stock Market CRASH / Correction
- How to Protect Your Self From a Stock Market CRASH / Bear Market?
- Chinese Tech Stocks CCP Paranoia
- VIES - Variable Interest Entities
- CCP Paranoid
- Best AI Tech Stocks ETF?
- Best UK Investment Trust
- AI Stocks Buying Pressure Evaluation
- AI Stocks Portfolio Current State
- AI Stocks Portfolio KEY
- What to Buy Today?
- INVEST AND FORGET HIGH RISK STOCKS!
- High Risk Stocks KEY
- Bitcoin Trend Forecast Current State
- Crypto Bear Market Accumulation Current State
- Crazy Crypto Exchanges - How to Buy Bitcoin for $42k, Sell for $59k when trading at $47k!
My analysis schedule includes:
- Silver Price Trend Analysis, AI Stocks Portfolio Update - 30% Done
- China House Prices CRASH! War with China Mega-trend Defence Stocks
- How to Get Rich! - 90% done - This is a good 6 month work in progress nearing completion.
- UK House Prices Trend Analysis, including an update for the US and a quick look at Canada - 15% done
- US Dollar and British Pound analysis
- Gold Price Trend Analysis - 10%
Your de-risked along the highs analyst.
Nadeem Walayat
Copyright © 2005-2021 Marketoracle.co.uk (Market Oracle Ltd). All rights reserved.
Nadeem Walayat has over 35 years experience of trading derivatives, portfolio management and analysing the financial markets, including one of few who both anticipated and Beat the 1987 Crash. Nadeem's forward looking analysis focuses on UK inflation, economy, interest rates and housing market. He is the author of five ebook's in the The Inflation Mega-Trend and Stocks Stealth Bull Market series that can be downloaded for Free.
 Nadeem is the Editor of The Market Oracle, a FREE Daily Financial Markets Analysis & Forecasting online publication that presents in-depth analysis from over 1000 experienced analysts on a range of views of the probable direction of the financial markets, thus enabling our readers to arrive at an informed opinion on future market direction. http://www.marketoracle.co.uk
Disclaimer: The above is a matter of opinion provided for general information purposes only and is not intended as investment advice. Information and analysis above are derived from sources and utilising methods believed to be reliable, but we cannot accept responsibility for any trading losses you may incur as a result of this analysis. Individuals should consult with their personal financial advisors before engaging in any trading activities.
Nadeem Walayat Archive |
© 2005-2022 http://www.MarketOracle.co.uk - The Market Oracle is a FREE Daily Financial Markets Analysis & Forecasting online publication.


