Everything Peaked in 1980 – The Waning Effects Of Inflation
Economics / Inflation Aug 14, 2021 - 10:35 PM GMTBy: Kelsey_Williams
EVERYTHING PEAKED IN 1980
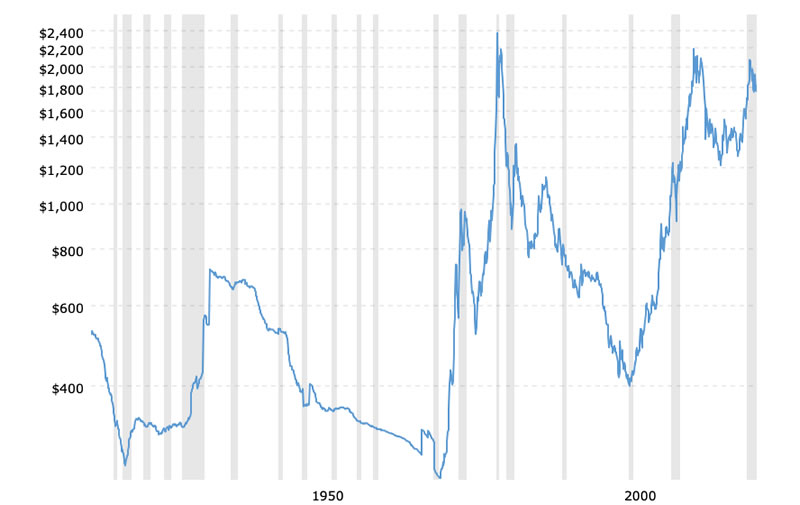
Both gold and crude oil peaked at all-time highs in 1980. Those highs are still intact when the effects of inflation are accounted for. Below are the charts for both gold and crude oil…
Gold Prices (inflation-adjusted) – 100 Year Historical Chart
Crude Oil Prices (inflation-adjusted) – 70 Year Historical Chart
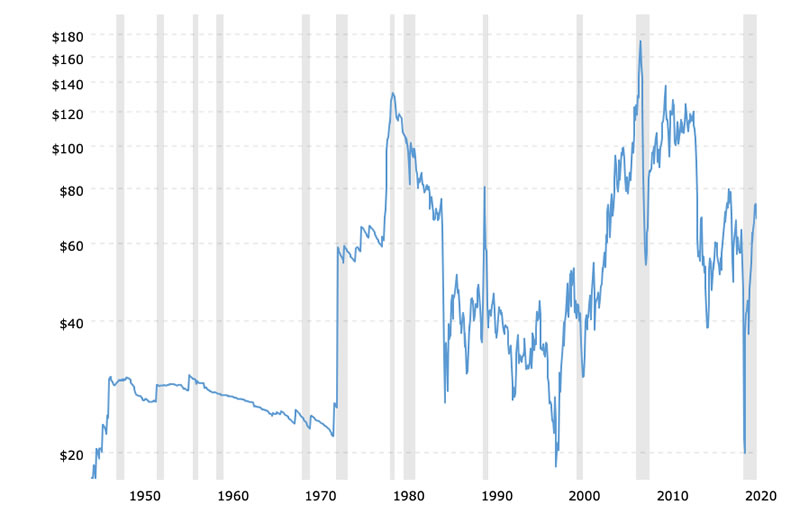
Given their unique characteristics and uses, their price patterns are amazingly similar; which is interesting, but not indicative of any correlation.
What is important is that the price of gold today ($1730 oz.), in inflation-adjusted terms, is twenty-five percent less compared to its 1980 peak ($2287 oz.).
Crude oil is considerably less expensive. Its current price of $66 per barrel is cheaper than its inflation-adjusted 1980 peak of $132 per barrel by fifty percent.
Another way to say this is that the cost of oil today is the equivalent of $20 per barrel in 1980 prices.
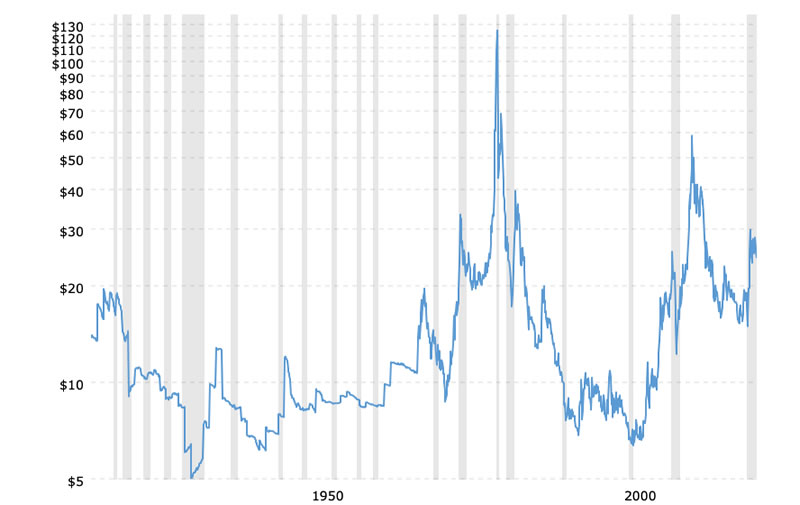
The silver price also peaked in 1980 and is cheaper today by more than eighty percent in inflation-adjusted terms. Even in nominal terms, silver is cheaper by more than fifty percent ($23.00 oz compared to $49.00 oz.) compared to its 1980 peak…
Silver Prices (inflation-adjusted) – 100 Year Historical Chart
Prices for some commodities, such as wheat and sugar, peaked prior to 1980.
The nominal price of wheat peaked at $12.00 per bushel in March 2008. That was nearly double the nominal wheat price peak of $6.32 per bushel in February 1974.
However, in inflation-adjusted terms, it was only slightly more than one-third of its 1974 peak. At $7.19 per bushel currently, wheat is nearly eighty percent less expensive than in 1974.
The current sugar price at $.1867 per pound is cheaper by almost seventy percent compared to its nominal price peak of $.60 per pound in 1974; and ninety percent cheaper in inflation-adjusted terms.
Recent talk about “soaring prices” and “hyperinflation” is somewhat overdone. For more than forty years the prices of most items have declined in inflation-adjusted terms.
DECLINES IN ECONOMIC ACTIVITY
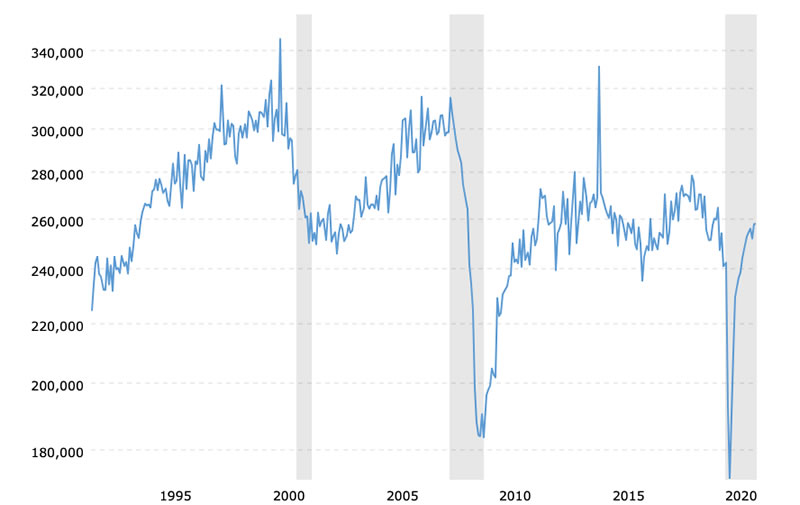
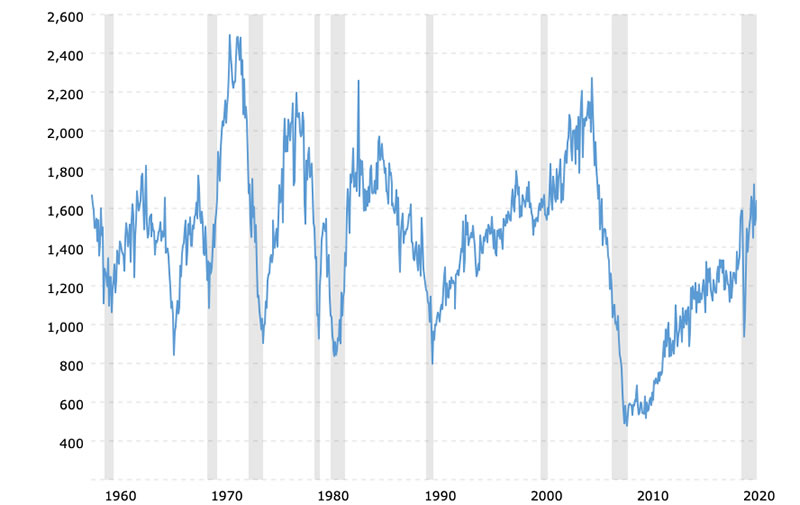
Also there are declines in specific areas of economic activity. See the charts below for durable goods orders, housing starts and capacity utilization rates…
Durable Goods Orders – Historical Chart
Housing Starts – Historical Chart
Capacity Utilization Rate – 50 Year Historical Chart
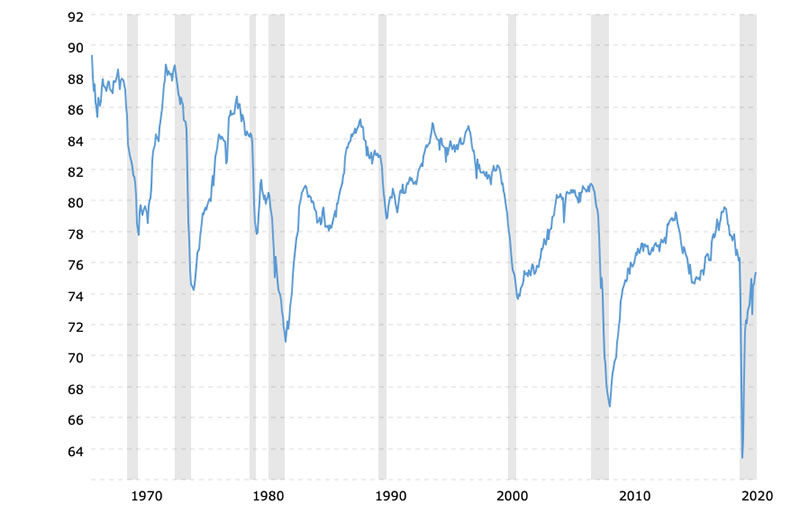
The trends in lower prices and weaker economic activity are the effects of inflation that is losing its intended impact.
Regardless of the increasing amounts of inflation (money and credit) that the Federal Reserve creates, it cannot predict or depend on the intended stimulus effect that was apparent at times in the past.
This is because the effects of cumulative inflation result in increasing volatility and unintended consequences.
The obvious sign of inflation’s effects is the loss of purchasing power in the currency (US dollar); but the elements of volatility and unpredictability counter the intended stimulus.
MORE INFLATION? NO CHOICE IN THE MATTER
Over time, more and more inflation yields less and less of the intended results. This is much like the pattern experienced during drug addiction. We have reached the point where the Fed cannot tell how much inflation is ‘necessary’ and how much is too much.
Is a certain amount of inflation really ‘necessary’? It is if you want to maintain relative stability and avoid the pain of collapse and economic depression.
Unfortunately, following that prescription means committing to endless inflation. Ironically, the pain of withdrawal from our inflationary addiction is necessary in order to heal. The choice is between getting better, which includes painful withdrawal symptoms of credit collapse, deflation and economic depression; OR getting sicker and possibly dying. (see The Federal Reserve And Drug Addiction)
At this point in time, a decision might be thrust upon us which is triggered by one or more of those unintended consequences.
STRAIGHT FROM THE HORSE’S MOUTH
Here is another chart which shows very clearly how the effects of inflation are waning…
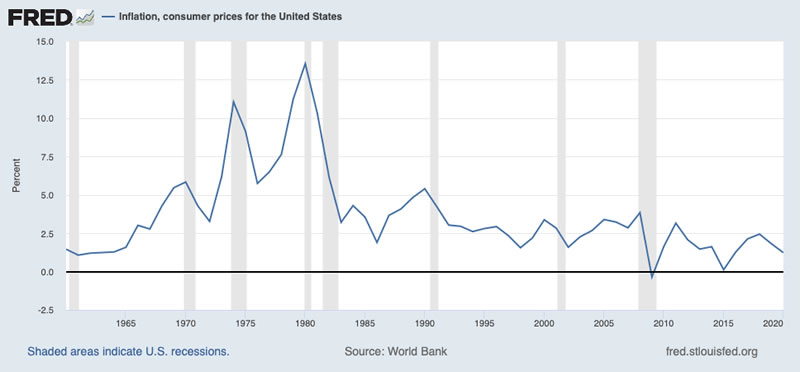
(What is FRED? Short for Federal Reserve Economic Data, FRED is an online database consisting of hundreds of thousands of economic data time series from scores of national, international, public, and private sources. FRED, created and maintained by the Research Department at the Federal Reserve Bank of St. Louis)
As can be seen on the chart, the effects of inflation peaked in 1980.
THE END IS NIGH
As far as what is meant by Chairman Powell and Treasury Secretary Yellen regarding the term “transitory” as it has been applied to current inflation rates, I believe they are both correct.
More important is the reasoning and motivation behind their use of the term.
The Fed and the Treasury (Yellen) know very well that the biggest risk factor today is not hyperinflation (see Two Reasons Hyperinflation Is Unlikely). Rather, it is a lack of liquidity.
The lack of liquidity could easily morph into credit collapse and economic depression. These things are the natural end results of over a century of inflation.
Use of the term transitory in referring to inflation deflects attention away from the threat of a deflationary collapse. If one is truly worried about whether or not current higher prices for goods and services is temporary, then one won’t be as likely to ask other more embarrassing questions.
One of those possible questions concerns whether the Fed really has any control over things. They don’t. Remember, the effects of inflation are unpredictable.
Also, Fed efforts for the past two decades have been primarily focused on putting out fires and patching leaky boats.
All decisions and policies put forward by the Fed might better be characterized as window dressing. The patient is on life support and there isn’t much to do except wait for the eventual end.
Kelsey Williams is the author of two books: INFLATION, WHAT IT IS, WHAT IT ISN’T, AND WHO’S RESPONSIBLE FOR IT and ALL HAIL THE FED!
By Kelsey Williams
http://www.kelseywilliamsgold.com
Kelsey Williams is a retired financial professional living in Southern Utah. His website, Kelsey’s Gold Facts, contains self-authored articles written for the purpose of educating others about Gold within an historical context.
© 2021 Copyright Kelsey Williams - All Rights Reserved Disclaimer: The above is a matter of opinion provided for general information purposes only and is not intended as investment advice. Information and analysis above are derived from sources and utilising methods believed to be reliable, but we cannot accept responsibility for any losses you may incur as a result of this analysis. Individuals should consult with their personal financial advisors.
© 2005-2022 http://www.MarketOracle.co.uk - The Market Oracle is a FREE Daily Financial Markets Analysis & Forecasting online publication.


