


Using Leading Economic Indicators to Forecast Economic Recessions
Economics / Recession 2008 - 2010 Oct 22, 2008 - 11:17 AM GMTBy: Paul_L_Kasriel

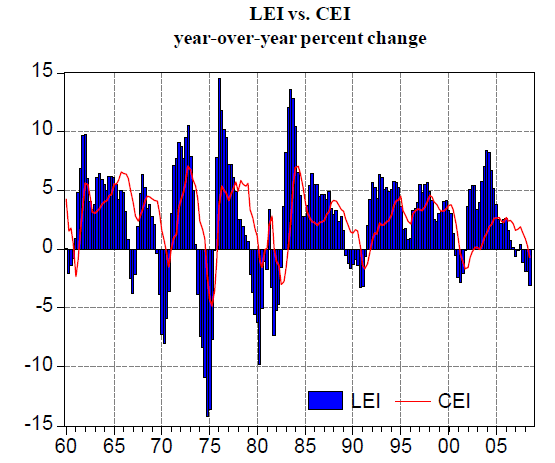
 On a year-over-year basis, the quarterly average of the index of Leading Economic Indicators (LEI) began contracting in the first quarter of 2007. With the exception of the third quarter of 2007, the quarterly average of the LEI has continued to contract. We alerted our readers that multiple consecutive quarters of year-over-year contractions in the LEI usually were the harbinger of recessions. We had ignored the history of the LEI's recession-predictive powers in the past and were determined not to repeat that mistake.
Many of our mainstream peers mocked the message being sent by the Leading Indicators, derisively referring to them as the Mis -Leading Indicators. Now, of course, everyone knows that the U.S. economy has entered a recession even though the NBER has not gotten around to acknowledging it. We also knew that the S&P 500, a component of the LEI, usually peaks before a recession sets in. That is why it is helpful for investors to know when a recession is imminent . It does investors little good to know it months after the recession has begun.
The index of Coincident Economic Indicators (CEI) peaked in October 2007. It is likely that the NBER will declare that the onset of this recession began in the first quarter of 2008.
Below is a chart of the year-over-year percent changes in the quarterly averages of the LEI and the CEI. Investors might be wise to study it, save it and update it.
By Paul L. Kasriel
The Northern Trust Company
Economic Research Department - Daily Global Commentary
Copyright © 2008 Paul Kasriel
Paul joined the economic research unit of The Northern Trust Company in 1986 as Vice President and Economist, being named Senior Vice President and Director of Economic Research in 2000. His economic and interest rate forecasts are used both internally and by clients. The accuracy of the Economic Research Department's forecasts has consistently been highly-ranked in the Blue Chip survey of about 50 forecasters over the years. To that point, Paul received the prestigious 2006 Lawrence R. Klein Award for having the most accurate economic forecast among the Blue Chip survey participants for the years 2002 through 2005.
The opinions expressed herein are those of the author and do not necessarily represent the views of The Northern Trust Company. The Northern Trust Company does not warrant the accuracy or completeness of information contained herein, such information is subject to change and is not intended to influence your investment decisions.
Paul L. Kasriel Archive |
© 2005-2022 http://www.MarketOracle.co.uk - The Market Oracle is a FREE Daily Financial Markets Analysis & Forecasting online publication.