New set of Priorities needed for Unstoppable Global Warming
Politics / Climate Change Jul 29, 2021 - 03:44 PM GMTBy: Richard_Mills
Heads of state gathered on Dec. 12, 2015, for the 21st conference of the parties to the United Nations Framework Convention on Climate Change (UNFCCC). When the Paris agreement, as it came to be known, came into effect on Nov. 4, 2016, 196 countries agreed to try and limit the warming of the Earth by 2 degrees Celsius, and preferably 1.5 degrees C, compared to pre-industrial levels, by mid-century.
The 2-degree threshold is often used by researchers as a target in efforts to slow climate change, including a recent report by Wood Mackenzie entitled ‘Champagne supercycle: Taking the fizz out of the commodity price boom’.
In the report, the Scotland-based consultancy says another commodities supercycle is on the horizon, but it will be different from any that have come before:
Fossil fuels won’t be in the vanguard and the winners will be the industrial metals needed to electrify society — cobalt, lithium, copper, nickel, and aluminium.
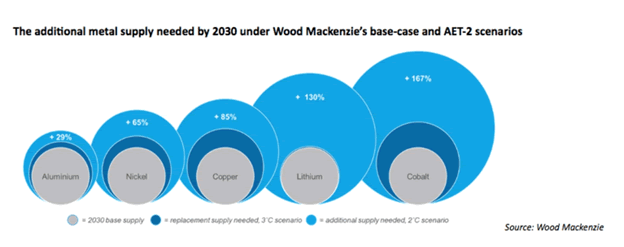
Under Wood Mackenzie’s Accelerated Energy Transition-2 (AET-2) scenario, which is consistent with limiting the rise in global temperatures since pre-industrial times to 2 °C, 360 million tonnes (Mt) of aluminium, 90 Mt of copper, and 30 Mt of nickel will feed the energy transition over the next 20 years. This level of additional metal presents obvious challenges for producers and consumers alike.
That last sentence is quite an understatement. The report predicts by 2030, cobalt producers will have to add 167% more supply, ie. more than double the 140,000 tonnes per year of the battery metal currently mined. For nickel it’s a necessary 65% increase, for copper it’s +85%, and for lithium producers, 130% more supply needs to be found and extracted, either through hard rock mining, brine operations or clays.
These metals are already under supply constraints even without a clean energy transition. Take copper as an example.
Copper
The demand pressure about to be exerted on copper producers in the coming years all but guarantees a market imbalance, resulting in copper becoming scarcer, and dearer, with each ambitious green initiative rolled out by governments, whose backs are against the wall due to negative fall-out from global warming.
The problem is existing copper mines are running out of ore, and the capital being invested in new mines is far below the level needed.
According to research by S&P Global Market Intelligence, of 224 sizable copper deposits discovered in the past 30 years, only 16 have been found in the last decade.
It takes seven to 10 years, at minimum, to move a copper mine from discovery to production. In regulation-happy jurisdictions like Canada and the US, the time frame is more like 20 years.
The pipeline of copper development projects is the lowest it’s been in decades.
As we have reported, without new capital investments, Commodities Research Unit (CRU) predicts global copper mined production will drop from the current 20 million tonnes to below 12Mt by 2034, leading to a supply shortfall of more than 15Mt. Over 200 copper mines are expected to run out of ore before 2035, with not enough new mines in the pipeline to take their place.
Some of the largest copper mines, like Grasberg in Indonesia, and Chuquicamata in Chile, are seeing their reserves dwindle; they are having to dramatically slow production due to major capital-intensive projects to move operations from open pit to underground.
Instead of sending exploration teams around the world turning over rocks to find the next gigantic copper deposit, the main way copper companies have added reserves is by lowering their cut-off grades. This is the minimum grade needed to make a unit of rock economic to extract at a given price. Any ore below this grade stays in the ground.
In a recent report, Goehring & Rozencwajg Associates found that between 2001 and 2014, 80% of new reserves came from re-classifying waste rock into mineable ore, ie., lowering the cut-off grade.
Yet there is only so far a miner can go in lowering the cut-off grade. At a certain point, it doesn’t matter how much the price rises, lowering the cut-off involves too many costs; mining then becomes un-economic.
Examples of such costs might be, the grades are simply too low, even at a higher price; the metallurgy becomes more difficult at a lower grade; trying to convert waste rock to reserves means going to a far-flung jurisdiction where there all kinds of added costs, like paying off a foreign government, or high royalties.
The authors of the above report contend that even with copper prices above $10,000 per tonne ($4.53/lb), reserves cannot keep growing, specifically at porphyry deposits. Their analysis also suggests that “we are quickly approaching the lower limits of cut-off grades,” concluding that
“If this is correct, then we are rapidly approaching the point where reserves cannot be grown at all.” In other words, peak copper. Remember, the definition of peak copper (or peak anything) is when production stops growing. If reserves aren’t increasing, there will eventually be nothing left to mine. Production will have to reach a peak, then decline.
This in itself is a shocking revelation. It suggests the copper mining industry has gone as far as it can in lowering cut-off grades further, meaning it is no longer possible to add large amounts of reserves — especially given that porphyry deposits are typically low-grade, in the 0.3 to 0.4% Cu range. The industry, the report alludes to, is nearing its production peak:
Our models strongly suggest copper mine supply growth will grind to a halt this decade. The number of new world-class discoveries coming online will decline substantially and depletion problems at existing mines will accelerate. Also, geological constraints surrounding copper porphyry deposits, which is where we get 80% of our copper, a subject few analysts and investors understand, will contribute to the problems.
Greenfield and brownfield reserve additions are expected to disappoint through the decade, according to the report. S&P Global Market Intelligence estimates that new discoveries averaged nearly 50Mt annually between 1990 and 2010. Since then, new discoveries have fallen by 80% to only 8Mt per year.
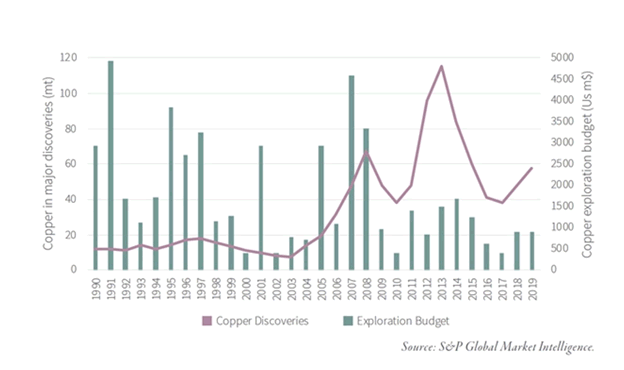
Goehring & Rozencwajg therefore forecast that stagnating copper mine supply, already colliding with strong demand, will push copper prices far higher than anyone expects.
“The previous copper bull market took place between 2001 and 2011 and saw prices rise seven-fold: from $0.60 to $4.62 per pound. The fundamentals today are even more bullish,” the firm states, adding:
“We would not be surprised to see copper prices again advance a minimum of seven-fold before this bull market is over. Using $1.95 as our starting point, we expect copper prices to potentially peak near $15 per pound by the latter part of this decade.”
Spot copper has risen 40% over the past year, and more than doubled between a March 2020 pandemic low of $2.17/lb and a record-breaking $4.71/lb in May of this year.
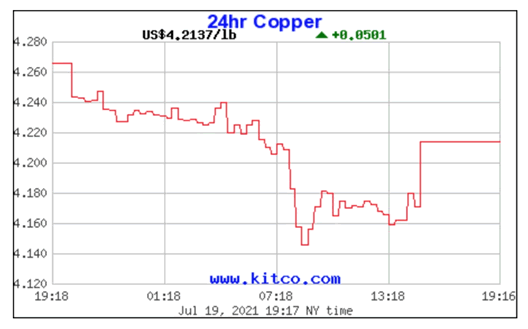
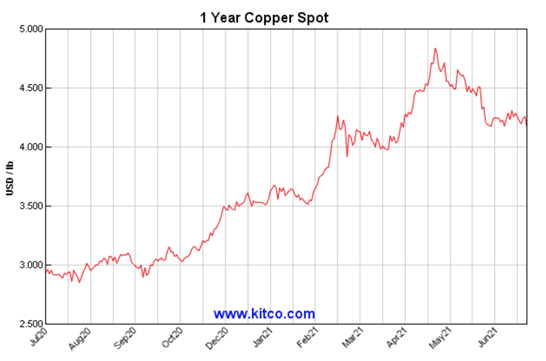
The main factors driving prices higher are increased Chinese orders amid a strong manufacturing sector; expectations of a return to growth following a disastrous 2020; trillions in promised green and blacktop infrastructure spending particularly in the US, Europe, and China; and supply disruptions resulting from virus-related mine closures particularly in South America, the locus of production.
Back to the Wood Mackenzie report, Woodmac says $50 trillion of investment is needed over the next three decades to achieve the targeted 1.5 degrees of global warming. (how does anyone come up with such a humongous dollar figure?)
These funds are meant to electrify societies’ infrastructure and engineer out the aspects of economic activity that most significantly contribute to carbon emissions. Metals supply will play a vital role in achieving this.
An earlier report from Wood Mackenzie found mining companies will need to spend $1.7 trillion over the next 15 years, to supply enough lithium, graphite, cobalt, copper and nickel for the shift to a low-carbon world.
The commodities consultancy says meeting new emissions targets being set by countries like Canada, the US, Britain, China and Japan, will mean large-scale deployment of electric vehicles, renewable power and electrical transmission, all of which will require copious metal content.
All well and good. Demand for battery metals and those required for renewable energy will very likely outstrip supply and lead to price increases for the foreseeable future, which is great news for resource investors.
Unstoppable warming
But I’m left with a lingering question: Will the cumulative efforts of governments to reduce carbon emissions, mainly through the electrification of the global transportation system, and switching from dirty sources of energy like coal, to clean renewables, actually have the desired effect of slowing climate change?
Well cleaning up our home, our planet, will go a long way to providing a liveable environment – where humans will be able to live – will certainly help. But in my opinion, attempting to limit carbon emissions to 2 degrees C, or 1.5 degrees, by spending 50 trillion dollars on electrification and decarbonization, is a fool’s errand. As I have argued before, climate change is a natural phenomenon that will run its course, regardless of human intervention.
If you listen to mainstream media, climate change has only one antecedent: human-caused emissions of carbon dioxide and other gases (methane, water vapor, nitrous oxide) that have been spewing into the skies since the Industrial Revolution; these greenhouse gases have caused heat to become trapped within the lower atmosphere. While human-caused pollution is certainly causing the degregation of our soil, water and air, this theory does not take into account the natural cycles of cooling and warming that have driven climate change for billions of years.
Milankovitch’s Theory states that as the Earth travels through space around the sun, cyclical variations of three elements combine to produce variations in the amount of solar energy that reaches us. These three elements are:
• Variations in the Earth’s orbital eccentricity — the shape of the orbit around the sun, a 100,000-year cycle.
• Changes in obliquity or tilt of the earth’s axis — changes in the angle that Earth’s axis makes with the plane of Earth’s orbit, a 41,000-year cycle.
• Precession — the change in the direction of the Earth’s axis of rotation, a 19,000 to 23,000-year cycle.
These orbital processes are thought to be the most significant drivers of ice ages and, when combined, are known as Milankovitch Cycles. The last ice age, the Glacial Maximum, occurred between 27,000 and 24,000 years ago. But we know from geological records — studies of Danish and Swedish bogs and lakes, for example — that as the Earth has warmed and cooled over the centuries, the warmer periods are getting longer and the colder periods shorter. In order words, spread out over an extremely long-time sequence, the Earth is gradually getting hotter even as it warms and cools in cycles.
Climate is also affected by changes occurring within the sun, thus shifting the intensity of sunlight that reaches the Earth’s surface. These changes in intensity can cause either warming — stronger solar intensity — or cooling when solar intensity is weaker.
Despite the promises of politicians and certain business leaders who claim to have the answers to stop global warming, the truth is it is unstoppable. The inescapable conclusion? The world will keep warming, until it starts cooling. We are all on an upward global warming escalator that has no down option. The only question is, how fast will the escalator move?
In 2018 the world’s leading climate scientists warned there are only 12 years to go for warming to be kept to a maximum 1.5 degrees C. If, after a dozen years, not enough is done to slow global warming, a tipping point will be reached, beyond which the risk of droughts, floods and extreme heat, will significantly worsen.
How are we doing with that? Not so great. One only has to look at regional climate/ weather maps to see that major changes are taking place before our very eyes. Last month a “heat dome” settled over much of western North America, sending temperatures soaring and triggering extreme heat warnings.
More than 40 new records were set in British Columbia, including Lytton, which recorded Canada’s highest-ever temperature of 49.6 C. Days later, the town of 1,000 people was destroyed by forest fire.
The heat wave killed nearly 500 people in BC, more than triple the number who normally die over a five-day period.
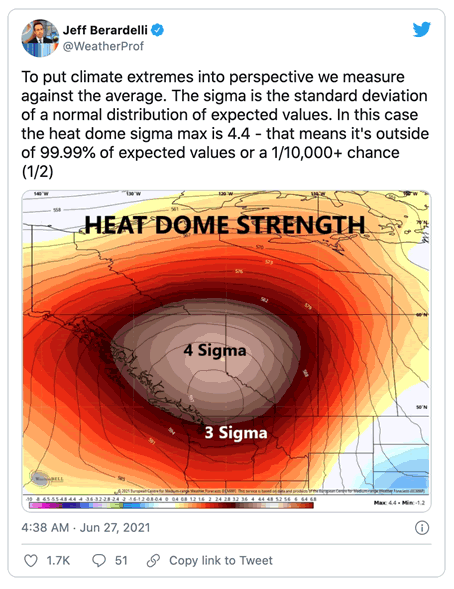
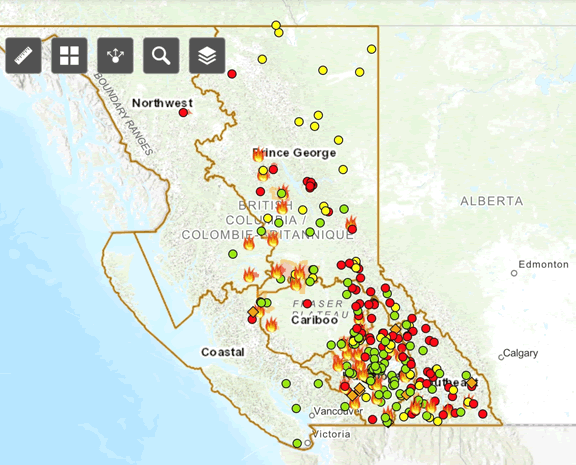
At time of writing there were 241 active forest fires according to the BC Wildfire Service, and 1,135 year to date, burning just over 275,000 hectares of forest. Despite it only being July (most fires typically occur in August and September), the province has nearly surpassed the 10-year average of 1,356 wildfires over a full fire season.
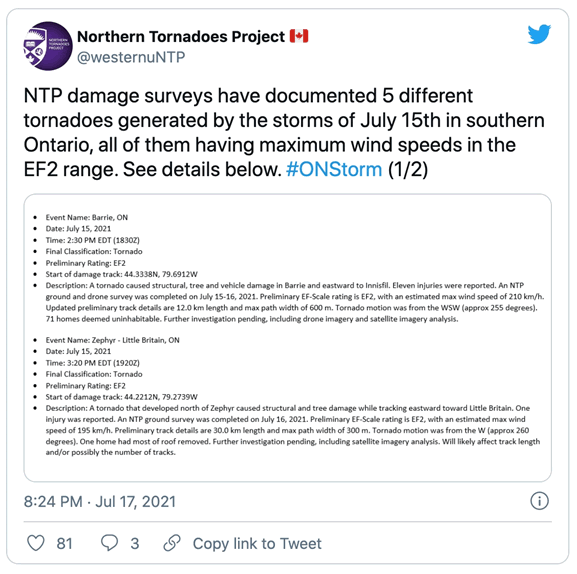
So far this summer there has also been freak weather in Ontario, where a tornado designated as EF-2 (wind speeds up to 217 km/h) slammed into a residential neighborhood in Barrie, destroying homes and injuring 11 people.
The twister was one of five recorded in southern Ontario last Thursday.
In Europe, at least 170 people were killed by floods in Germany and Belgium, with rescuers on Saturday racing to find survivors of a record rainfall so heavy it submerged cars.
Heat so intense it killed hundreds of vulnerable people in their homes. Forest fires capable of leveling a community in minutes. Tornadoes more commonly seen in Kansas than Ontario. Flooding so bad it trapped people in their vehicles.
We don’t have to wait nine years for the worst impacts of climate change to occur. They’re already here.
Doing what we can
Instead of trying to slow climate change, wouldn’t we be better off cleaning up the planet best we can, and preparing for the worst consequences of warming? For example, we can fortify coastal cities against storm surges, relocate factories and populations sited too close to rising seas, and stop polluting the earth, the air, and our rivers, lakes and oceans.
Our research has shown there is no shortage of work to be done in these areas. We could start by eliminating single-use plastic. Banning fracking/ stopping the development of an LNG industry in British Columbia, and mining responsibly, are my other two suggestions.
Cut the plastic
Plastics have become so ubiquitous – in un-recycled plastic bags, packaging of all shapes and sizes, single-use straws and utensils, coffee pods, plastic microbeads, etc. – that they have literally become part of us. Only 10% of plastic containers are recycled. The rest ends up in landfills, rivers, lakes and finally, the ocean.
Tiny particles shed from millions of plastic items are getting into the soil, the water, the air and the food chain.
For years it has been known that plastic breaks down into tiny particles that are consumed by shellfish, fish and mammals higher up the food chain, presenting a danger to human health if consumed.
It is estimated there are over 150 million tonnes of plastic in the ocean. Around 8 million tonnes enter the seas every year — the equivalent of dumping a truckload of plastic garbage every minute.
Suggestions for reducing plastic include choosing re-usable grocery bags, buying in bulk, and avoiding goods wrapped in plastic packaging – which account for about 40% of non-fibrous plastics. Participating in your city’s plastic-container recycling program is a no-brainer.
Kill LNG
We can also lobby government officials to stop relying on natural gas as a “transition fuel” that will take us from fossil-fueled power to renewable energies like solar power and wind.
Natural gas, of course, is a fossil fuel. But it is seen as cleaner than oil, particularly when it is transported. A natural gas spill is invisible (though no less damaging to the environment); an oil spill evokes ghastly images of ruined beaches, dead seals and oily sea birds.
In September 2018, Shell and its partners announced their decision to go ahead with LNG Canada in Kitimat – after a $C5.3 billion tax break by BC’s NDP. The handout was necessary to make the project economical, and no doubt to entice the consortium to provide some 10,000 construction jobs and $24 billion in provincial revenue over the next 40 years.
Included in the fine print?
- LNG Canada is not required to pay PST during the construction period, effectively giving the consortium an interest-free loan for two decades and an annual savings of $19 million to $21 million.
- The NDP government also eliminated the LNG income tax, a tax they supported while in opposition. In its place, a natural gas tax credit gives LNG Canada an additional 3% corporate income tax cut.
- The consortium will get a rebate from the BC carbon tax amounting to about $62 million a year, after the tax, currently at $40 a tonne, rises to $50/tonne next year.
Also, LNG Canada will pay about half the regular cost of electricity from the Site C dam, amounting to a $32 million to $52 million annual subsidy that will have to be reimbursed by provincial ratepayers.
How do we get the natural gas for LNG? We frack it. Most of the conventional natural gas formations in British Columbia have already been depleted. What’s left is “tight gas” trapped in shale rock formations, primarily the Montney in northeastern BC. According to the BC Oil and Gas Commission, only 22% of BC’s remaining natural gas reserves are conventional; the rest are unconventional, which involves fracking.
Natural gas is mostly methane (CH4), a potent greenhouse gas that is over 25 times more efficient than carbon dioxide at trapping heat in the atmosphere over a 100-year period. (the Intergovernmental Panel on Climate Change (IPCC) says methane is 86 times more damaging than CO2 over a 20-year period)
As use of fracking technology has increased, worries are growing about its impact on our fresh water supply.
Fracking just one well can use 2 to 8 million gallons of water with the major components being water (90%), sand or proppants (8-9.5%), and chemicals (0.5-2%). One 4-million-gallon fracturing operation would use from 80 to 330 tons of chemicals and each well will be fracked numerous times. Many of these chemicals have been linked to cancer, developmental defects, hormone disruption, and other conditions. The water gets contaminated after the fracking process and is disposed of in tailings ponds or is injected into deep underground reservoirs.
Cracked wells and rock movement frequently leak fracking fluid and gases into nearby groundwater supplies. Fracturing fluid leak-off (loss of fracturing fluid from the fracture channel into the surrounding permeable rock) can exceed 70% of injected volume.
Methane concentrations are 17 times higher in drinking-water wells near fracturing sites than in normal wells. Hydraulic fracturing increases the permeability of shale beds, creating new flow paths and enhancing natural flow paths for gas leakage into aquifers.
Fracking has also caused benzene poisoning among pregnant native women in northeastern BC – natural gas country – and is known to cause earthquakes.
In other cases it has depleted water supplies, depriving other users of necessary irrigation or drinking water. The need for so much fresh water in the fracking process has resulted in the construction of at least 90 unlicensed dams in northeastern BC, some of which may be unsafe.
According to The National Post, LNG will bring a lot more marine traffic to BC’s waters — about 350 LNG tankers per year.
It has long been suspected that engine noise from freighters, cruise ships and other large vessels disturbs cetaceans, the family of marine mammals that includes whales, porpoises and dolphins.
Noise from the ships impacts the ability of whales to navigate and to identify food, a process known as echolocation. Cetaceans use sound to bounce off salmon and other prey in order to locate them.
The loudest ships have been measured at 173 underwater decibels, which equates to around 111 dB in air – around the same level as a loud rock concert.
Mine responsibly
And finally, we can act to ensure that the mining industry extracts minerals with as light a footprint as possible with minimal environmental damage.
Canada is in the beginning stages of developing an electric vehicle supply chain that capitalizes on the country’s rich battery metals endowment and cheap hydro-electric power particularly in Quebec and British Columbia.
The federal government and the provincial governments of Quebec and Ontario have stepped up with hundreds of millions in EV supply chain commitments, recognizing that taxpayer-funded support is needed to help push out such a disruptive technology as vehicle electrification.
As EV and grid energy storage applications continue to drive up demand for battery minerals, more production of lithium, graphite, and especially, sulfide nickel, will be needed.
Nickel deposits come in two forms: sulfide or laterite. About 60% of the world’s known nickel resources are laterites, which tend to be in the southern hemisphere. The remaining 40% are sulfide deposits.
Nickel sulfide deposits are formed from the precipitation of nickel minerals by hydrothermal fluids. The main benefit of sulfide ores is that they can be concentrated using a simple flotation technique.
Nickel laterite deposits are formed from the weathering of ultramafic rocks and are usually operated as open pit mines. There is no simple separation technique for nickel laterites. The rock must be completely molten or dissolved to enable nickel extraction. As a result, laterite projects require large economies of scale at higher capital costs to be viable. They are also generally much higher cash-cost producers than sulfide operations.
Yet large-scale sulfide deposits are extremely rare. Historically, most nickel was produced from sulfide ores, including the giant (>10 million tonnes) Sudbury deposits in Ontario, Canada, Norilsk in Russia and the Bushveld Complex in South Africa.
However, existing sulfide mines are becoming depleted, and nickel miners are having to go to the lower-quality, but more expensive to process, as well as more polluting, nickel laterites such as found in the Philippines, Indonesia and New Caledonia.
Reuters has reported on the multi-billion-dollar Chinese-led project to produce battery-grade nickel chemicals, that Indonesia hopes will attract EV manufacturers to the country. At least four high-pressure acid leach (HPAL) plants are currently under construction, led by Chinese stainless steel producers and battery makers.
HPAL – whose performance record has been highly mixed — involves processing ore in a sulfuric acid leach at temperatures up to 270 degrees C and pressures up to 600 psi to extract the nickel and cobalt from the iron-rich ore; the pressure leaching is done in titanium-lined autoclaves.
The advantage of HPAL is its ability to process low-grade nickel laterite ores, to recover nickel and cobalt. However, HPAL is unable to process high-magnesium or saprolite ores, it has high maintenance costs due to the sulfuric acid (average 260-400 kg/t at existing operations), and it comes with the cost, environmental impact and hassle of disposing of the magnesium sulfate effluent waste.
Recently Indonesia announced it will forbid mining companies from dumping mining waste into the ocean, a practice known as deep sea tailings (DST). To clarify: the government hasn’t actually banned DST, but by not issuing new permits, it could delay planned projects and complicate efforts to dispose of waste, Reuters reported. The lengthy wait means land tailings will eventually become “the only option,” a mining company source told the news outlet.
Not only do established nickel miners in Indonesia plan to continue the environmentally egregious practice of DST, due to cost considerations, the process of refining nickel to make nickel pig iron, and now, nickel matte, is highly energy-intensive (it relies on coal-fired power) and creates a lot of air pollution.
Producing 1 ton of nickel in nickel pig iron creates 45 tons of carbon dioxide emissions, compared to just 20 tons for coal-powered aluminum and steel production requiring an average 2 tons of CO2 per ton of metal.
Chinese stainless steel producer Tsingshan plans to supply nickel matte, an intermediate nickel product based on converted nickel pig iron (NPI) used in steelmaking, to Chinese companies Huayou and CNGR Advanced Materials, who will further process it into nickel sulfate.
The process is not considered any greener than HPAL, in fact it may be more polluting. “The technology is definitely real, but does not meet ESG standards,” Bloomberg quotes Jon Lamb, portfolio manager at metals and mining investment firm Orion Resource Partners. “As consumers are focused on the lifecycle carbon intensity of their supply chains it is difficult to see how this production would earn a spot in these supply chains.”
Conclusion
By 2050, according to the National Renewable Energy Laboratory (NREL), the electrification of transportation and other sectors will require a doubling of US generation capacity. This could create a problem for certain states lacking in power grid infrastructure, such as California, which saw rolling blackouts last year during a heat wave; and Texas, which during a bitterly cold spell this past winter, had its power grid fail, cutting off electricity to nearly 5 million homes; up to 700 people are thought to have perished, according to Texas Monthly.
The cold snap also grounded Austin’s fleet of 12 new electric buses, prompting many to wonder what could happen in future, when the whole fleet is planned to go electric and there’s a power interruption.
More electric cars are expected to require greater charging infrastructure and a lot more grid capacity. Where that power comes from will determine how close the United States will get to meeting its emissions reduction objectives. According to the US Department of Energy, the penetration rate of EVs could grow to 15% by 2030, while NREL expects the electricity to power all of those cars will come primarily from renewable energy sources and natural gas.
We know that highly polluting natural gas is the wrong way forward if “going green” is the goal.
We’ve all heard the hype about renewables, but how green are they? Especially considering all the metals that need to be dug up and processed before wind turbines, solar farms and hydroelectric dams can produce carbon-free electricity?
You may be surprised by the answer.
For many years it was too expensive, but now, the cost of solar has come down so much, it is competitive with even the cheapest energy sources including coal.
But to build a utility-scale solar power requires a large amount of land. This can interfere with other uses, such as food production. Clearing the land and moving the earth with machinery run on diesel fuel pollutes the air and causes soil compaction, erosion, and the alteration of natural drainage channels. Covering the area with PV modules involves the removal of plants, and the displacement of animal/ loss of habitat. These modules also require frequent washing with detergents that may pollute local water sources. Solar thermal power plants have similar impacts to PV systems but use more water, for cooling and as a working fluid.
Desertification is human-caused degradation of land, including unsustainable farming, overgrazing, clear-cutting, misuse of water and industrial activities. Climate change accelerates desertification because warmer temperatures dry out once-fertile land, which then makes the area even hotter. Removing plants from the ground also increases greenhouse gas emissions, since they can no longer serve as carbon sinks. As we strip away the amount of available land for food production, we are literally depriving ourselves of the means to survive.
The 17 components needed to build solar panels must all be mined. They include arsenic for semiconductor chips; phosphorous, selenium, silica, tellurium, gallium and indium for solar cells; bauxite, boron and cadmium for thin film solar cells; titanium dioxide for solar panels; coal and iron ore needed to make steel; copper for the wiring and solar cells; molybdenum for photovoltaic cells; and lead for batteries.
Wind is right up there with solar as a clean alternative to natural gas, coal and oil, but there are definitely environmental downsides. Chief among these are the negative impacts on bird life. Bird and bat populations can be injured or killed when they fly through spinning turbine blades. Offshore wind turbines can also harm marine birds. The noise that wind turbines produce may be a problem for people living near them. Some have even claimed they cause health effects such as migraines, dizziness and poor sleep quality.
Like solar power, wind requires large tracts of land that may be put to more appropriate use such as farming or conservation. A few extra windmills might not seem like a big deal, but they’re a bit like prisons and garbage dumps: NIMBY.
A wind turbine has about the same number of mined components as a solar cell. They include aggregates, crushed stone, bauxite, clay, shale, gypsum, sand and gravel for cement and concrete; coal and cobalt for magnets; iron ore, limestone and molybdenum for steel and steel alloys; zinc for galvanizing; and rare earths for permanent magnets.
Keep in mind, though, this isn’t baseload power, it’s intermittent power. Releasing energy all at once, in a controlled way, to thousands of households, is not currently possible without lithium-based storage batteries, the materials for which, like EV batteries, must all be extracted from minerals.
The materials for wind and solar are mined in more than 60 countries. Some, like Peru, Chile, Mexico, South Africa, the United States and Australia, have laws and up to date mining codes that protect the environment and local labor forces from exploitation. Others, such as Indonesia, Venezuela, the Congo, Zambia and Papua New Guinea… not so much.
Large hydropower plants have a significant impact on animal habitats and the flow of natural watercourses, including preventing fish from swimming back to their spawning grounds. There is always the potential for a dam to break causing monumental devastation.
The rush to a new green economy has a dark side. As the demand for metals required to fuel it continues to ramp up, the pressures among mining companies to meet that demand are only going to intensify.
Many more new mines will need to be build and existing mines will have to produce more. A lot of the “low-hanging fruit” has already been picked. The minerals left are often found in remote areas far from the prying eyes of government officials, or in countries that lack the appropriate legal and environmental protections.
Despite the most optimistic predictions of a carbon-free world run on renewables, a lot can go wrong. The amount of money involved — Wood Mackenzie predicts $1 trillion will have to be invested in key energy transition metals by 2035 to meet the growing needs of decarbonization — carries with it the temptation to rape and pillage the planet.
Considering the fact, not the theory, that global warming is going to happen regardless of what humanity does to try and prevent it, it’s worth asking: Instead of trying to slow climate change, wouldn’t we be better off cleaning up the planet best we can, and preparing for the worst consequences of warming?
Richard (Rick) Mills
subscribe to my free newsletter
Ahead of the Herd Facebook
Legal Notice / Disclaimer
Ahead of the Herd newsletter, aheadoftheherd.com, hereafter known as AOTH.
Please read the entire Disclaimer carefully before you use this website or read the newsletter. If you do not agree to all the AOTH/Richard Mills Disclaimer, do not access/read this website/newsletter/article, or any of its pages. By reading/using this AOTH/Richard Mills website/newsletter/article, and whether or not you actually read this Disclaimer, you are deemed to have accepted it.
Any AOTH/Richard Mills document is not, and should not be, construed as an offer to sell or the solicitation of an offer to purchase or subscribe for any investment.
AOTH/Richard Mills has based this document on information obtained from sources he believes to be reliable but which has not been independently verified. AOTH/Richard Mills makes no guarantee, representation or warranty and accepts no responsibility or liability as to its accuracy or completeness. Expressions of opinion are those of AOTH/Richard Mills only and are subject to change without notice. AOTH/Richard Mills assumes no warranty, liability or guarantee for the current relevance, correctness or completeness of any information provided within this Report and will not be held liable for the consequence of reliance upon any opinion or statement contained herein or any omission. Furthermore, AOTH/Richard Mills assumes no liability for any direct or indirect loss or damage or, in particular, for lost profit, which you may incur as a result of the use and existence of the information provided within this AOTH/Richard Mills Report.
AOTH/Richard Mills is not a registered broker/financial advisor and does not hold any licenses. These are solely personal thoughts and opinions about finance and/or investments – no information posted on this site is to be considered investment advice or a recommendation to do anything involving finance or money aside from performing your own due diligence and consulting with your personal registered broker/financial advisor. You agree that by reading AOTH/Richard Mills articles, you are acting at your OWN RISK. In no event should AOTH/Richard Mills liable for any direct or indirect trading losses caused by any information contained in AOTH/Richard Mills articles. Information in AOTH/Richard Mills articles is not an offer to sell or a solicitation of an offer to buy any security. AOTH/Richard Mills is not suggesting the transacting of any financial instruments but does suggest consulting your own registered broker/financial advisor with regards to any such transactions
© 2005-2022 http://www.MarketOracle.co.uk - The Market Oracle is a FREE Daily Financial Markets Analysis & Forecasting online publication.


