


Could Bitcoin Price CRASH Target A Bottom Below $7500?
Currencies / Bitcoin Jun 23, 2021 - 02:23 PM GMTBy: Chris_Vermeulen

Bitcoin has followed our Excess Phase Peak breakdown pattern almost perfectly. Each phase of any Excess Phase Peak is important to understand as it relates to other asset classes. For example, as an asset, like Bitcoin, begins a Excess Phase breakdown in trend, other assets will likely follow along. The psychological impact of a major decline can often result in traders also expecting breakdown events in various other asset classes.
Before we begin to go into deeper detail regarding this Excess Phase Peak setup in Bitcoin, I suggest taking a minute or two to review our earlier research posts related to this pattern: How To Spot The End Of An Excess Phase – Part I November 25, 2020; How To Spot The End Of An Excess Phase – Part II November 27, 2020; and, Bitcoin Completes Phase #3 Of Excess Phase Top Pattern – What Next May 20, 2021. As this breakdown continues to unfold, we want to warn you that other asset classes (as mentioned above) may follow this trend as trader/investor psychology often impacts future expectations/trends across the globe.
If traders suddenly develop an expectation that the recent price rally in the global markets is at risk of failing, or that the downtrend in Bitcoin may have broader implications across other assets, we may see a bigger rotation in the global markets throughout the rest or 2021 (and beyond).
Phase #4 of the Excess Phase Peak Setup Is Pending
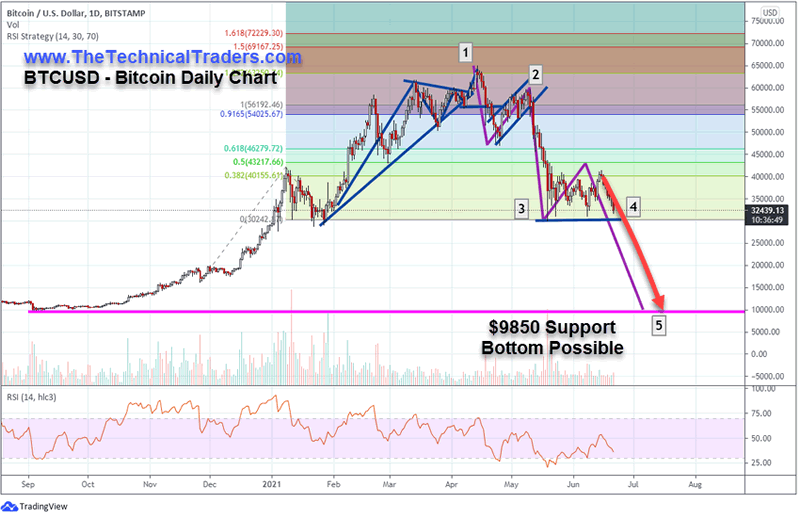
Now, as we begin to enter Phase #4 of the Excess Phase peak pattern, the final breakdown of intermediate support, our research suggests Bitcoin may fall to levels below $10k. A confirmed start of Phase #4 would be indicated with a downward breach of the $30,240 level.
Traders need to be prepared for the next phase of this move. This may last many months as Bitcoin attempts to identify a key support level that will act as a new momentum base for any potential future upside price trending. The current breakdown in trend is expected to breach the $30,240 level fairly soon. At that point, a stronger downside price trend will likely wipe out another 60% to 75% of the current price valuation – resulting in a bottom forming below $10k. This potential bottom level may not be the ultimate low for Bitcoin. Traders are advised to wait for a strong bottom/base to setup before attempting to jump into any new upward price trending expectations. As mentioned above, the process of setting up this ultimate bottom/base may take many months to complete.
Be sure to sign up for our free market trend analysis and signals now so you don’t miss our next special report!
Let’s go over the Excess Phase Peak Pattern Setup, illustrated in the chart below.
- Phase #1: The rally to the ultimate peak level
- Phase #2: The breakdown of that peak level, setting up the initial support level and prompting a sideways price Flag/Pennant price channel
- Phase #3: The breakdown of the #2 sideways price channel leading to a steep decline to intermediate support – which acts as a temporary sideways bottom.
- Phase #4: The breakdown of the intermediate support level which ultimately leads to the strongest price decline targeting the ultimate bottom in price.
- Phase #5: Identifying the ultimate bottom/momentum base in price. This trending phase can last many months (possibly more than 12 months at time), or could be in the form of a deep “V” bottom.
After the completed five phases, a new momentum bottom will setup which will likely prompt early stage accumulation again – eventually prompting another rally attempt.
Could Bitcoin Target A Bottom Below $7500?
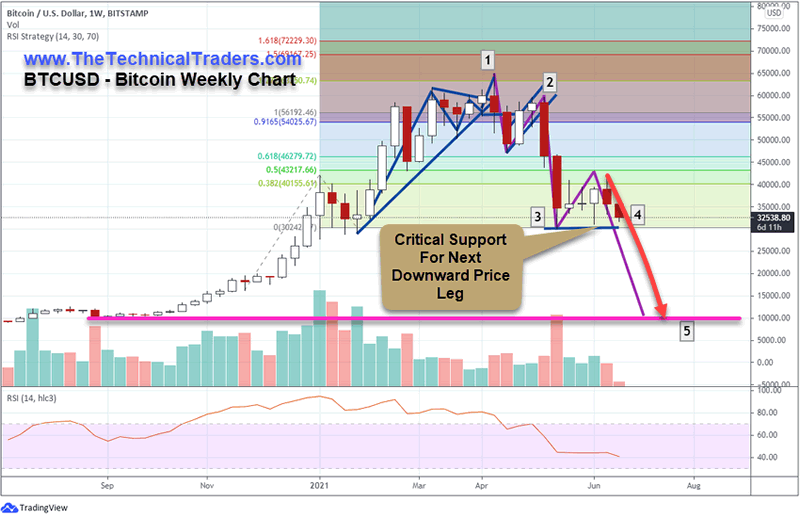
My team and I believe the lower support level in September 2020, near $9850, is a likely target for the ultimate bottom. Although, we want to warn you this level may act as a temporary support level if the unwinding of this Phase #5 downward trend persists beyond our expectations.
This Weekly Bitcoin chart highlights the current three completed phases and the pending #4 and #5 phases of the Excess Phase Peak pattern. We find it interesting that we highlighted this pattern setup more than 7 months ago and warned that an Excess Phase Rally was taking place back in November 2020. Even though Bitcoin rallied far beyond our expectations for a peak (near $32k), we strongly believe the ultimate bottom setup from this extended Excess Phase collapse will prompt another incredible opportunity once the final phase of this pattern is complete.
To help answer your question, “where is the ultimate bottom in price?”, the simple answer is “we don’t know exactly where Bitcoin will find an ultimate bottom price level.”. We believe the $9850 level is a likely target for a bottom. But we also believe the unwinding of this broad market excess phase peak may prompt a bigger downtrend that may last many months as global assets break away from the recent rally phase. This means we may see a broader unwinding of the global markets throughout the end of 2021 and into 2022.
Many major commodities have recently broken their rally phase trends and have started to move dramatically lower in recent weeks. The US major indexes, particularly the Dow Jones and the Transportation Index, have begun to break upward sloping price channels. Gold and Silver have reacted, recently, to the FOMC statements by breaking strongly to the downside. All of these setups are indicative of a change in trader/investor psychology – a breakdown of expectations.
I advise traders and investors to be cautious with regards to trying to pick a bottom as we watch the markets attempt to identify new support levels. Bitcoin will likely break below the $30,240 level (the Phase #3 intermediate support level) in a big way sometime in the near future. Once that happens, we may see the broader markets attempt a downside price correction as well – as psychology often leads to some type of “herd mentality”.
Want to know how our BAN strategy is identifying and ranking various sectors and ETFs for the best possible opportunities for future profits? Please take a minute to learn about my BAN Trader Pro newsletter service and how it can help you identify and trade better sector setups. My team and I have built this strategy to help us identify the strongest and best trade setups in any market sector. Every day, we deliver these setups to our subscribers along with the BAN Trader Pro system trades. You owe it to yourself to see how simple it is to trade 30% to 40% of the time to generate incredible results.
Have a great day!
Chris Vermeulen
www.TheTechnicalTraders.com
Chris Vermeulen has been involved in the markets since 1997 and is the founder of Technical Traders Ltd. He is an internationally recognized technical analyst, trader, and is the author of the book: 7 Steps to Win With Logic
Through years of research, trading and helping individual traders around the world. He learned that many traders have great trading ideas, but they lack one thing, they struggle to execute trades in a systematic way for consistent results. Chris helps educate traders with a three-hour video course that can change your trading results for the better.
His mission is to help his clients boost their trading performance while reducing market exposure and portfolio volatility.
He is a regular speaker on HoweStreet.com, and the FinancialSurvivorNetwork radio shows. Chris was also featured on the cover of AmalgaTrader Magazine, and contributes articles to several leading financial hubs like MarketOracle.co.uk
Disclaimer: Nothing in this report should be construed as a solicitation to buy or sell any securities mentioned. Technical Traders Ltd., its owners and the author of this report are not registered broker-dealers or financial advisors. Before investing in any securities, you should consult with your financial advisor and a registered broker-dealer. Never make an investment based solely on what you read in an online or printed report, including this report, especially if the investment involves a small, thinly-traded company that isn’t well known. Technical Traders Ltd. and the author of this report has been paid by Cardiff Energy Corp. In addition, the author owns shares of Cardiff Energy Corp. and would also benefit from volume and price appreciation of its stock. The information provided here within should not be construed as a financial analysis but rather as an advertisement. The author’s views and opinions regarding the companies featured in reports are his own views and are based on information that he has researched independently and has received, which the author assumes to be reliable. Technical Traders Ltd. and the author of this report do not guarantee the accuracy, completeness, or usefulness of any content of this report, nor its fitness for any particular purpose. Lastly, the author does not guarantee that any of the companies mentioned in the reports will perform as expected, and any comparisons made to other companies may not be valid or come into effect.
Chris Vermeulen Archive |
© 2005-2022 http://www.MarketOracle.co.uk - The Market Oracle is a FREE Daily Financial Markets Analysis & Forecasting online publication.