


Stock Market Cycles Tipping From Euphoria To Complacency – Gold Setting Up For Rally Above $2000 Again?
Stock-Markets / Financial Markets 2021 May 28, 2021 - 01:45 PM GMTBy: Chris_Vermeulen

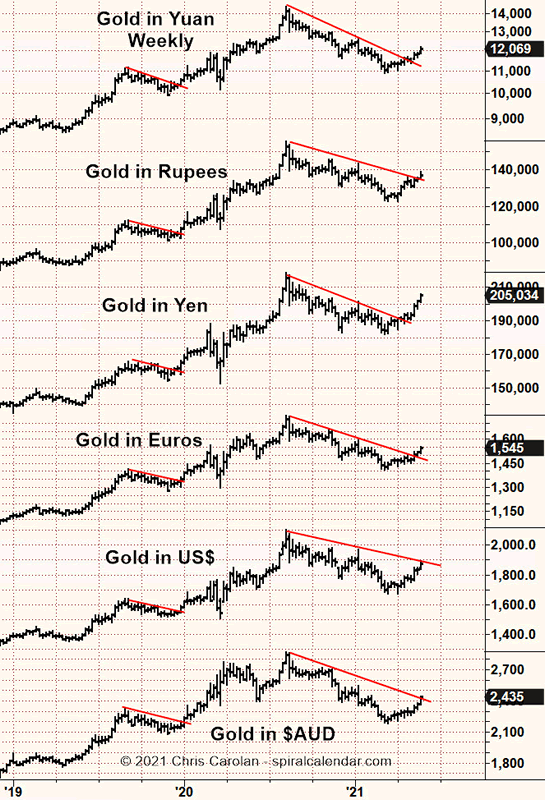
Gold has set up a very strong confluence pattern across multiple foreign currencies recently. This upside confluence pattern suggests that Gold has now moved into a much stronger bullish price phase compared to various currency pairs. This upside move in precious metals aligns very well with my broad market cycle phase research. I urge traders/investors to start paying attention as we transition into this new longer-term cycle phase.
Recently, my team and I published a series of articles related to these longer-term cycle phases and how they related to the current market trends. The biggest concept we want to highlight is that we’ve transitioned away from an Appreciation cycle phase and into the early stages of a Depreciation cycle phase. Often, near this type of transition, the global markets experience a unique type of Excess Phase Peak. This type of price pattern happens because traders/investors are slower to identify the end of a trend and often attempt to continue the Thrill/Euphoric phase of the previous market trend – until the markets prove them wrong.
You can review some of our most recent research posts about these topics here: US Dollar Breaks Below 90 – Continue To Confirm Depreciation Cycle Phase (May 23, 2021); Bitcoin Completes Phase #3 Of Excess Phase Top Pattern – What Next? (May 20, 2021) and; What To Expect – A Critical Breakout Warning For Gold, Silver & Miners Explained (May 18, 2021).
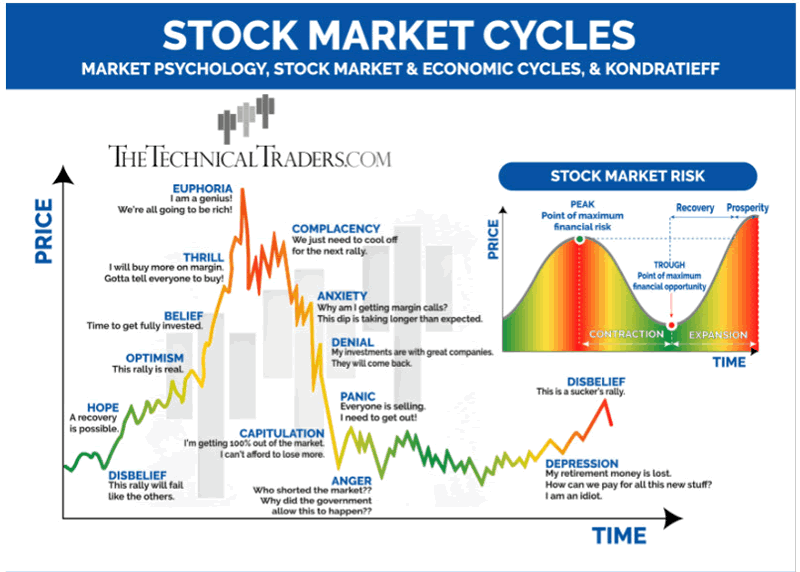
Stock Market Cycles
The custom graphic shown below highlights the phases of typical market trends through various stages of market trends. My team and I believe we have crossed the peak level (or are very near to that crossover point) and have begun to move into the Complacency and Anxiety phases of the market trend. As suggested, above, the psychological process for traders/investors at this stage is to hope and plan for the never-ending bullish price trend while the reality of the market trend suggests a transition has already started taking place and the market phase has shifted.
Our research suggests the last Appreciation phase in the market took place from mid/late 2010 to mid/late 2019. That means we started a transition into a Depreciation cycle phase very near to the beginning of 2020. Our belief that a moderate price rotation is pending within the markets stems from the excess phase rally that took place after the COVID-19 virus event. We’ve witnessed the sideways price trend in precious metals over the past 8+ months which suggested that global traders were confident an economic recovery would take place (eventually). Yet, the question before everyone is, as we move away from an Appreciation cycle phase and into a Depreciation cycle phase, what will that recovery look like? Can we expect the recovery to be similar to levels seen in the previous Appreciation cycle phase? Let’s take a look at how these phases translated into trends in the past.
Appreciation and Depreciation Cycle Phases
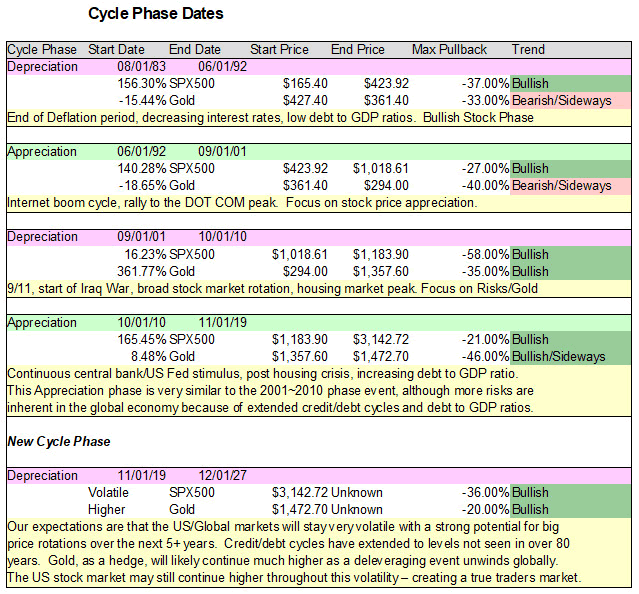
The first Depreciation cycle phase (1983~1992) took place after an extended deflationary period where the debt to GDP was rather low comparatively. It also took place within a decade or so after the US moved away from the Gold Standard. The strength in trending we saw in the US stock market was directly related to the decreasing interest rates and strong focus on credit/equities growth throughout that phase.
The second Depreciation cycle phase (2001~2010) took place after the DOT COM rally prompted a huge boom cycle in equities and as a series of US/global events rocked the US economy. First, the September 11, 2001 attack in New York, and second, by the engagement in the Iraq War. Additionally, the US Fed was actively supporting the US economy after the 9/11 terrorist attacks, which prompted many American’s to focus on supporting a stronger US economy. This, in turn, prompted a huge rally in the housing market as banks and policies supported a large speculative rally (FOMO) in Real Estate.
The current Depreciation cycle phase (2019~2027+) comes at a time where the US Fed has been actively supporting the US/global economy for more than 11 years and after an incredible rally in Real Estate and the US stock market. Additionally, a new technology, Crypto currencies, has taken off throughout the world as an alternate, decentralized, asset class – somewhat similar to how the DOT COM rally took off. As we’ve seen this incredible rally in global equities, Cryptos, commodities and other assets over the past 7+ years, we believe the last Appreciation cycle phase is transitioning into an Excess Phase Peak (see the Euphoria/Complacency phases above), which may lead to some incredibly volatile price trends in the future.
Be sure to sign up for our free market trend analysis and signals now so you don’t miss our next special report!
You may be asking yourself, “how does this translate into precious metals cycles/trends?” after we’ve gone through such a longer-term past cycle phase review…
The recent upside price trends in precious metals are indicative of two things; fear and demand. First, the economic recovery and new technology are increasing demand for certain precious metals and rare earth elements (such as battery and other technology). Second, the move in Gold and Silver recently is related to credit, debt, economic and cycle phase concerns. As we’ve seen Bitcoin move dramatically lower and as we start to move into a sideways price trend in the US stock market, there is very real concern that the past price rally has reached an intermediate Excess Phase Peak.
You can learn more about how I identify and trade the markets by watching my FREE step-by-step guide to finding and trading the best sectors. Of course, my BAN Trader Pro newsletter service does all the work for you, with my daily pre-market reports, proprietary research, and BAN trade alerts.
Chris Vermeulen
www.TheTechnicalTraders.com
Chris Vermeulen has been involved in the markets since 1997 and is the founder of Technical Traders Ltd. He is an internationally recognized technical analyst, trader, and is the author of the book: 7 Steps to Win With Logic
Through years of research, trading and helping individual traders around the world. He learned that many traders have great trading ideas, but they lack one thing, they struggle to execute trades in a systematic way for consistent results. Chris helps educate traders with a three-hour video course that can change your trading results for the better.
His mission is to help his clients boost their trading performance while reducing market exposure and portfolio volatility.
He is a regular speaker on HoweStreet.com, and the FinancialSurvivorNetwork radio shows. Chris was also featured on the cover of AmalgaTrader Magazine, and contributes articles to several leading financial hubs like MarketOracle.co.uk
Disclaimer: Nothing in this report should be construed as a solicitation to buy or sell any securities mentioned. Technical Traders Ltd., its owners and the author of this report are not registered broker-dealers or financial advisors. Before investing in any securities, you should consult with your financial advisor and a registered broker-dealer. Never make an investment based solely on what you read in an online or printed report, including this report, especially if the investment involves a small, thinly-traded company that isn’t well known. Technical Traders Ltd. and the author of this report has been paid by Cardiff Energy Corp. In addition, the author owns shares of Cardiff Energy Corp. and would also benefit from volume and price appreciation of its stock. The information provided here within should not be construed as a financial analysis but rather as an advertisement. The author’s views and opinions regarding the companies featured in reports are his own views and are based on information that he has researched independently and has received, which the author assumes to be reliable. Technical Traders Ltd. and the author of this report do not guarantee the accuracy, completeness, or usefulness of any content of this report, nor its fitness for any particular purpose. Lastly, the author does not guarantee that any of the companies mentioned in the reports will perform as expected, and any comparisons made to other companies may not be valid or come into effect.
Chris Vermeulen Archive |
© 2005-2022 http://www.MarketOracle.co.uk - The Market Oracle is a FREE Daily Financial Markets Analysis & Forecasting online publication.