


8 Stock Market Indicators in 1: Here's the Message of the Panic/Euphoria Model
Stock-Markets / Stock Market 2021 Apr 19, 2021 - 02:06 PM GMTBy: EWI

Prior model extremes occurred in March 2000 and October 2007
Elliott Wave International has been providing market analysis for more than four decades -- which includes many bull/bear market cycles.
That said, the public's current market mindset -- especially among inexperienced investors -- is a reminder of the extremes surrounding the 2000 market top, and a few others.
For example, a February 27 MarketWatch headline said:
A new wave of fearless retail investors is ready to pour $170 billion into stocks ...
Also, according to an early February Deutsche Bank survey of online brokerage users, 61% are under 34 years of age and 45% are in their first year of investing.
As Barron's reports (Feb. 25):
Younger, Savvier Investors Are Making Up a New Movement
So, all in all, there's no shortage of financial optimism.
Indeed, the March Elliott Wave Financial Forecast, a monthly publication which provides analysis of major U.S. financial markets, showed this chart and said:
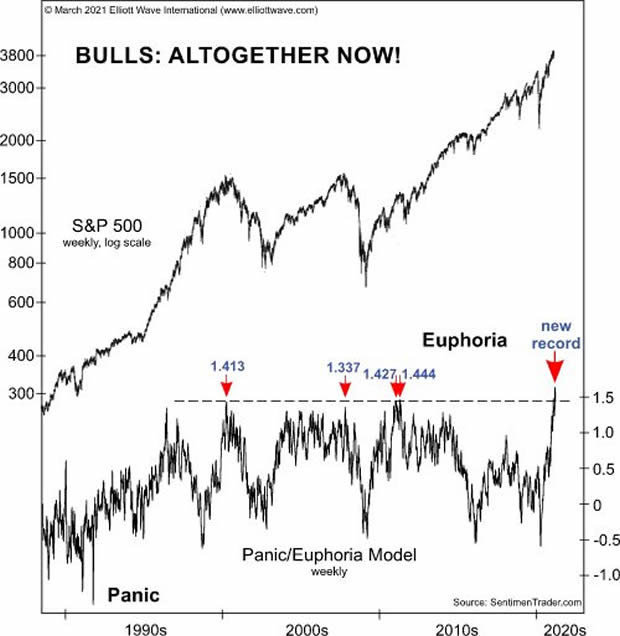
This chart shows SentimenTrader.com's version of the Panic/Euphoria Model, which is an amalgamation of eight indicators that range from New York Stock Exchange short interest to individual and advisory sentiment surveys and retail gas prices. Prior model extremes occurred at 1.413 on March 24, 2000, the day of the top in the S&P 500 that led to a 51% decline, and 1.337 on October 12, 2007, one day after the S&P 500 peaked and started a 58% decline. The other two extremes were 1.427 on January 7, 2011 and 1.444 on April 8, 2011, neither of which mattered immediately to stock prices, but the S&P soon declined 22% from May 2, 2011 to October 4, 2011. On February 12, 2021, one trading day before the high in the NASDAQ indexes, euphoria clearly got the best of the investment public as the model shot to a new record at 1.613.
It's important to know that this extreme in optimism ties in perfectly with what the Elliott wave model is conveying right now.
The beauty of the Elliott wave model is that it can help you to anticipate trend changes.
Here's a quote from Frost & Prechter's Elliott Wave Principle: Key to Market Behavior:
It is a thrilling experience to pinpoint a turn, and the Wave Principle is the only approach that can occasionally provide the opportunity to do so.
The ability to identify such junctures is remarkable enough, but the Wave Principle is the only method of analysis that also provides guidelines for forecasting.
Learn these Elliott wave guidelines for forecasting financial markets by reading the online version of Elliott Wave Principle: Key to Market -- 100% free!
All that's required for free access to this Wall Street classic is a Club EWI membership -- which is also free. Club EWI is the world's largest Elliott wave educational community (approximately 350,000 worldwide members) and members get free access to a treasure trove of Elliott wave resources on financial markets, investing and trading.
Get started now by following this link: Elliott Wave Principle: Key to Market Behavior -- free access.
This article was syndicated by Elliott Wave International and was originally published under the headline 8 Indicators in 1: Here's the Message of the Panic/Euphoria Model. EWI is the world's largest market forecasting firm. Its staff of full-time analysts led by Chartered Market Technician Robert Prechter provides 24-hour-a-day market analysis to institutional and private investors around the world.
© 2005-2022 http://www.MarketOracle.co.uk - The Market Oracle is a FREE Daily Financial Markets Analysis & Forecasting online publication.