Stocks and Bonds Inflationary Slingshot
Stock-Markets / Financial Markets 2021 Apr 17, 2021 - 01:30 PM GMTBy: Gary_Tanashian
Cost-push inflation could break out (and a note on gold)
Before beginning the post a little context is in order. We (NFTRH) anticipated the current pause in long-term Treasury yields (one indicator of inflation) because pro-inflation sentiment became over-done in March and was due for a cool down; so said a contrarian view. This post discussing the likelihood of more inflation to come is not written by a one-way bias booster. It’s important for credibility to make these distinctions from the herds running with the daily news cycle.
The short-term contrary sentiment situation against the inflation view began with the Bond King’s media-touted short of long-term Treasuries (i.e. expectation of higher yields), per one of our best macro tools…
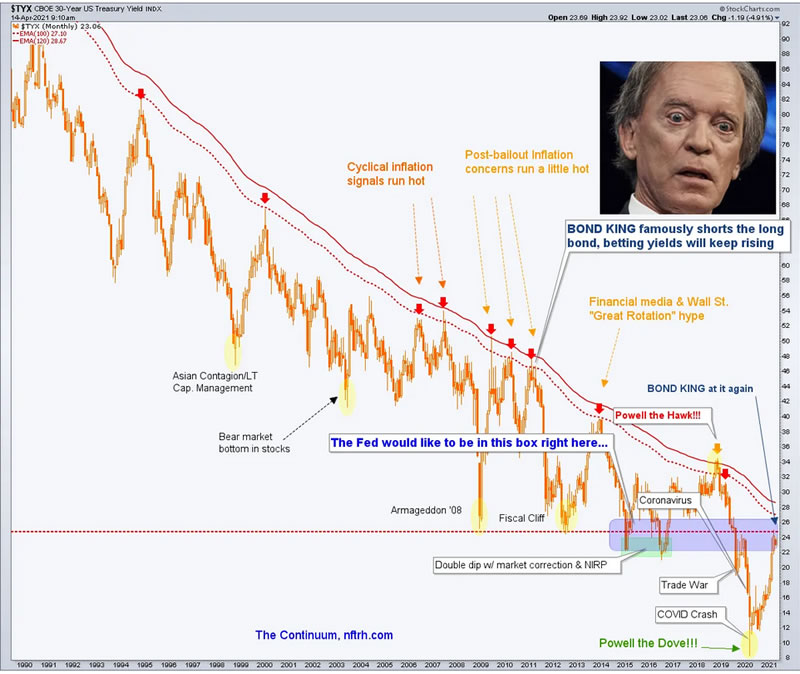
…and continued with news of 77% of Americans’ fear of inflation…
…as Ma & Pa were given a prime time view of the inflation problem. See Peter Schiff Scares Ma & Pa, Inflation Gets Tuckered Out…
…and importantly, with ISM’s latest release showing a booming manufacturing sector right along with booming costs paid by said manufacturers. See A Decidedly Different Look at the ISM RoB.
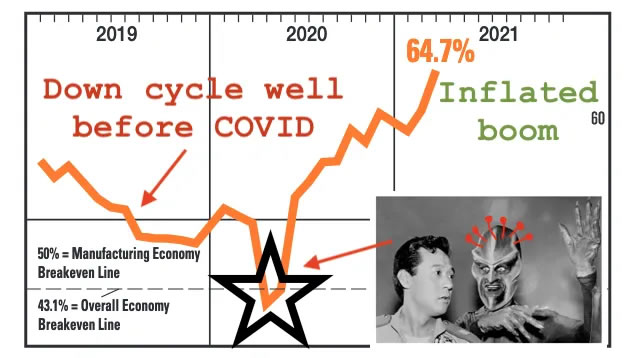
Above is the funny graphic (funny to me, anyway) I created for that post. Here are the hard numbers included in the ISM report, a fabulous headline reading of US manufacturing data for March.
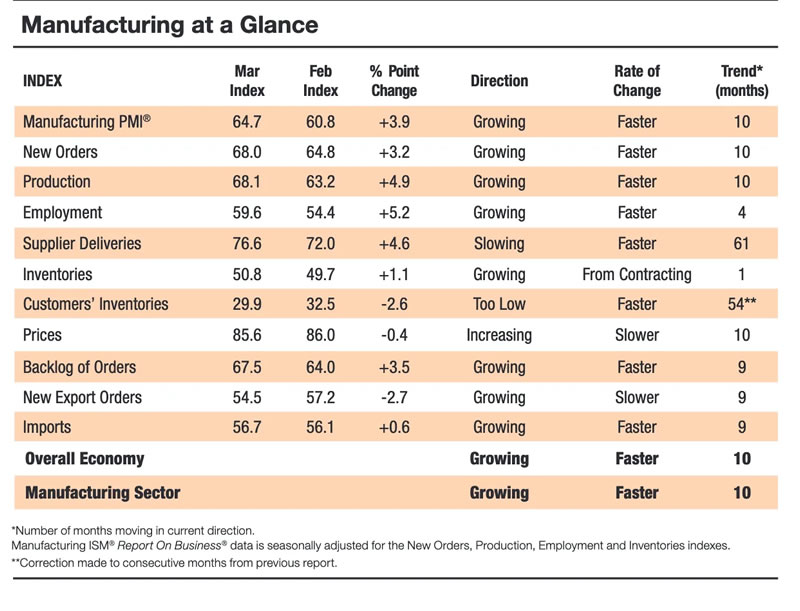
But here is the key component of the report, from the standpoint of an oncoming inflation problem.

All well and good. Inflation is not that bad yet, now is it? The CPI is on its perma-trend upward as usual. Producer prices (PPI) are rising but still in a manageable (sideways) trend.
PPI (St. Louis Fed) shows that flat trend, a product of the Goldilocks years of post-2011 (kicked off by Operation Twist and it’s expressed goal of “sanitizing” inflation signals right out of the macro). The Bernanke Fed literally painted the macro to behave a certain (non-inflationary) way.
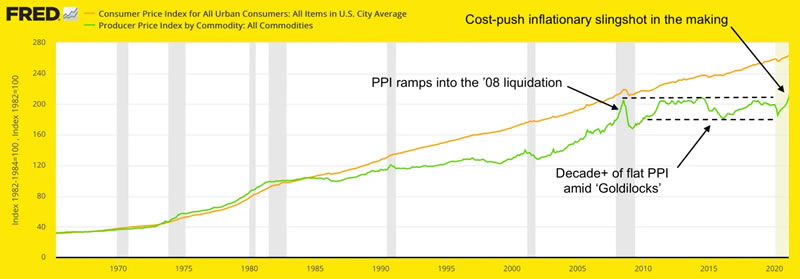
But here we may want to think about slingshots and counter-reactions if we believe that man made signals will not, cannot overpower natural market forces forever. In 2008 a climax to the commodity bubble (and logically, PPI) immediately preceded a massive liquidation of the whole inflated mess. It’s as if the consumer can get screwed slowly over the decades, but when manufacturing and its raw materials costs get out of hand, then it’s serious business.
This is the gateway to an inflation problem that will be readily recognized as damaging to the economy and to peoples’ everyday lives as rising input costs start to eclipse economic activity. But will the disaster be in the form of liquidation this time? Will PPI break out to new all time highs? It has actually already ticked a slight new high and it appears the Fed has no inclination to put its foot on the break. At least that is the card they are showing right now.
One reason to believe that maybe it will be different this time is because the Fed has already released the hounds, the inflationary hounds into the global macro playing field. In Q4 2008 NFTRH’s very first subscriber, the late Jonathan Auerbach (then managing partner of Auerbach Grayson) sent me one of his many memorable quotes as we had been discussing the oncoming inflationary operations by the Fed, simply writing “It’s inflation all the way, baby!”. For context, recall that in the Armageddon ’08 liquidation that was a most unpopular sentiment.
But back then the Fed had not released nearly the number of inflationary hounds as they did in 2020. M2 money supply has been cranked to an epic – genie out of the bottle – degree.
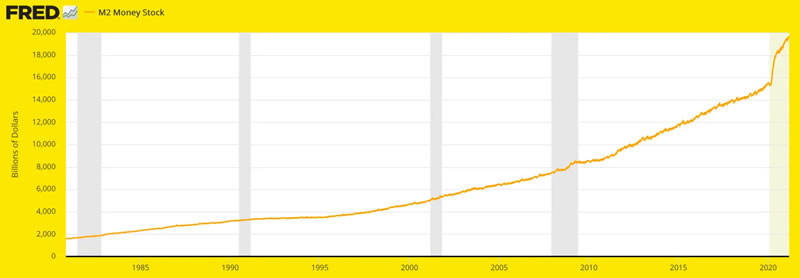
Considering the idea that Bernanke’s maniacal Operation Twist macro manipulation may just have helped kick the inflation can down the road for a decade in tandem with the strenuous increase in money supply today vs. all other instances, with manufacturing costs PUSHING into the economy, it could well be different this time as the Wizard finally loses control of the monetary/economic condition he has used for decades since gold was removed (as an official monetary instrument) from the equation in 1971.
Refer again to the CPI/PPI graph above. When exactly did consumer and producer prices start to rise persistently? Yup, after 1971.
As implied above, the PPI is the cost set that matters most where economic health is concerned. Consumers have been fed cheap credit on which to deal with their slowly but persistently rising costs. But when manufacturers get slammed with impulsively rising costs they either pass them along or go out of business.* When input costs get passed through supply chains economic activity starts to become more volatile, at best or starts to grind to a halt, at worst. Enter the battle with the Stag…
Gold got one little mention in the article above and that is because I cringe when inflation touts obsess on gold. It has so many other monetary and financial utilities, fairly pedestrian inflation protection among them. But if Stagflation (the more economically damaging form of inflation) enters the economy I would bet that gold’s utility vs. economically sensitive commodities will again come to the forefront.
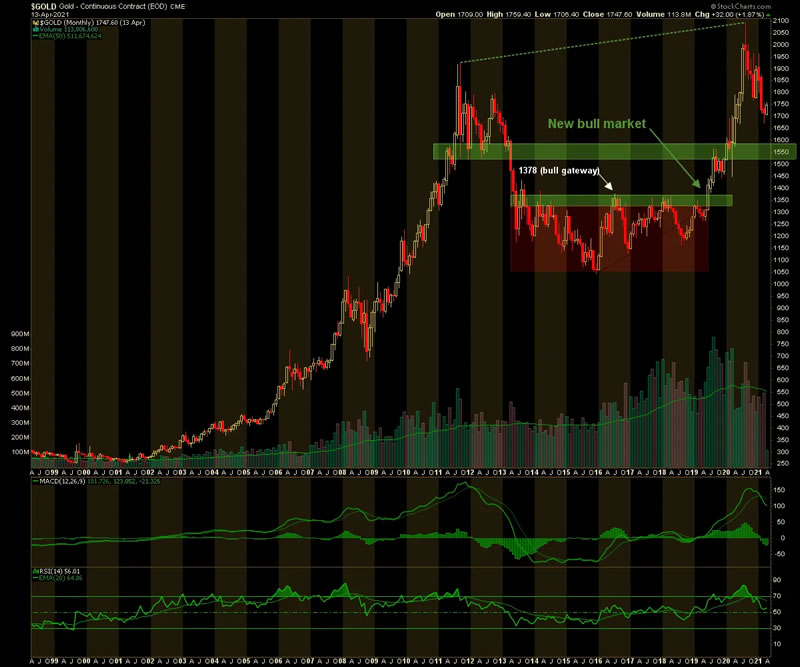
Gold is providing an opportunity for would-be buyers to enter the bull market that officially began in 2019 as its massive Cup (monthly chart) makes a painfully constructed Handle. This is a good thing. This is the period where the hangers-on are weeded out. Even better, the correction is nearer its end than its beginning if recent sentiment is a good guide, which for gold it usually is.
In NFTRH we have plotted the longer-term upside target and each week manage the ongoing short-term correction. But taking this big picture at face value, realize that gold actually led the macro out of the 2020 deflationary disaster and into the inflationary phase that everyone became so hysterical about by March, 2021.
It may or may not lead the next phase, a would-be transition to more virulent inflation, but it will certainly have valuable utility. And if somehow it is not different this time? If it’s another deflationary liquidation along the Continuum (1st chart above)? Well, history speaks for itself as gold led in 2001, 2008 and again in 2020 out of those deflationary episodes.
* Or continue to innovate through automation, which as a manufacturer I noted in my second ever public article in 2004. But against an inflationary firestorm, there are limits to the progress of productivity.
Subscribe to NFTRH Premium (monthly at USD $33.50 or a 14% discounted yearly at USD $345.00) for an in-depth weekly market report, interim market updates and NFTRH+ chart and trade setup ideas, all archived/posted at the site and delivered to your inbox.
You can also keep up to date with plenty of actionable public content at NFTRH.com by using the email form on the right sidebar and get even more by joining our free eLetter. Or follow via Twitter ;@BiiwiiNFTRH, StockTwits or RSS. Also check out the quality market writers at Biiwii.com.
By Gary Tanashian
© 2021 Copyright Gary Tanashian - All Rights Reserved
Disclaimer: The above is a matter of opinion provided for general information purposes only and is not intended as investment advice. Information and analysis above are derived from sources and utilising methods believed to be reliable, but we cannot accept responsibility for any losses you may incur as a result of this analysis. Individuals should consult with their personal financial advisors.
Gary Tanashian Archive |
© 2005-2022 http://www.MarketOracle.co.uk - The Market Oracle is a FREE Daily Financial Markets Analysis & Forecasting online publication.


