How to Stop Being Scared or Shaken Out Of Winning Trades
Stock-Markets / Stock Index Trading Mar 28, 2021 - 02:17 PM GMTBy: Chris_Vermeulen
The markets really frightened a lot of people in the last month. We’ve received lots of emails and comments from people wondering what’s happening in the markets and why the deeper downtrend didn’t prompt new trade triggers. Well, the quick answer is “this downtrend did prompt new BAN trade triggers and this pullback is still quite mild compared to historical examples”. Allow me to explain my thinking.
The recent FOMC meeting as well as the expiration of the future contracts usually prompts some broad market concerns. Many professional traders refuse to trade over the 7+ days near an FOMC meeting – the volatility levels are usually much higher and this can throw some trading strategies into chaos. Our BAN Trader Pro strategy handles volatility quite well most of the time.
Recently, the BAN Trader Pro strategy initiated new trade triggers of subscribers and myself. Our members are engaged in the best-performing assets for the potential upside price rally that may take place over the next couple of months. Our strategies target opportunities based on proven quantitative technology – not emotions and use proven position management to maximize gains while reducing drawdowns.
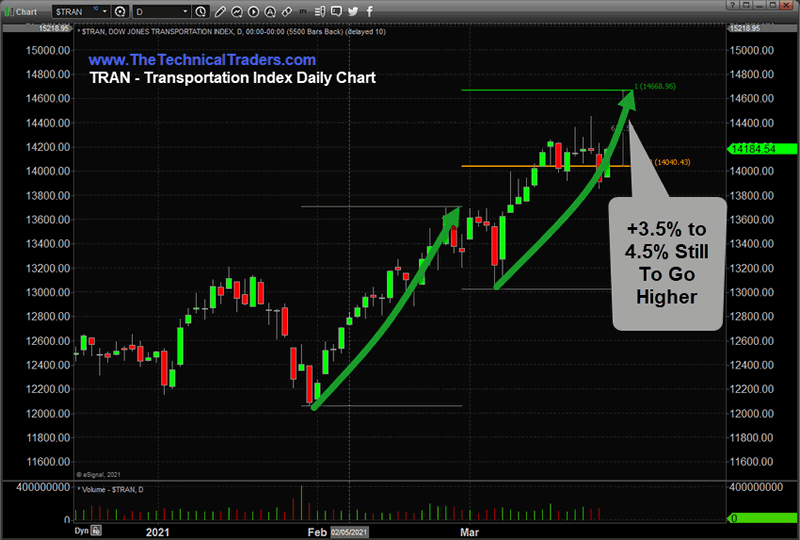
Transportation Index Daily Chart Is Bullish
This leading index shows early strength in the market with an upside target of $14,668. That is a 3.5%-4.5% upside move ahead of us.
Recently, we’ve seen some substantial support in the Transportation Index that aligns with our BAN Trader Pro strategy. The rally in the Transportation Index, which usually leads the US economy by at least 2 to 4 months, suggests the markets are actively seeking out a support level/momentum base for another rally phase.
Using a Fibonacci Extension tool, we can clearly see the TRAN has another 3.5% to 4.5% to rally before reaching the 100% measured move target near $14,668. This level represents a full 100% rally phase equaling the initial rally from levels near $12,000 which started back in February 2021.

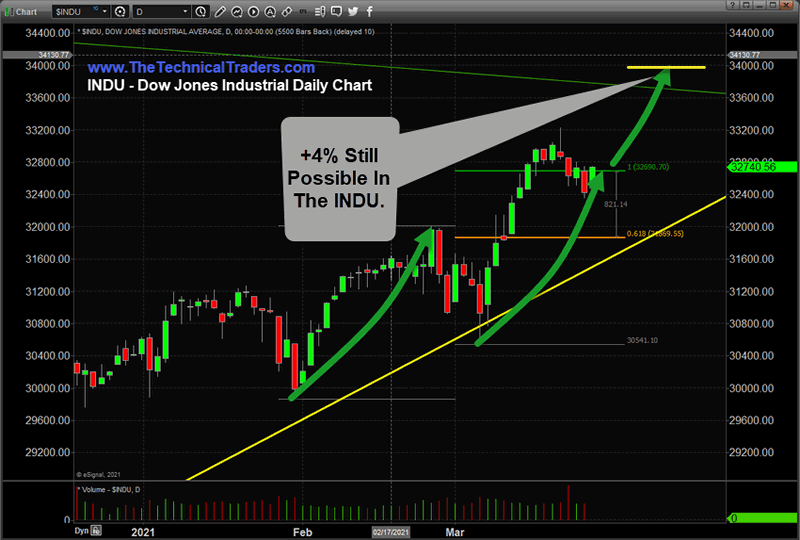
Dow Jones Industrial Index Daily Chart is Bullish
The Dow Jones Industrial Average has already reached the 100% Fibonacci Measured move – and broken above that level. If the markets rally from this recent pullback, we believe a 4% to 5%+ rally in the Dow index is very possible. This type of bullish price trend suggests a target level near $34,000.
One thing, many traders fail to consider is these 4% to 5% rallies in the Transportation Index and/or the Dow Jones Industrial Average will likely prompt an 8% to 20%+ rally in some of the best-performing assets/sectors. For example, after the bottom in early February, during a time when the index rallied less than 1%, the best-performing assets we tracked rallied more than 7% to 25%. The strength of these top-performing sectors/symbols can be very powerful – even while the US major indexes are drifting sideways.

If the Transportation and Dow Index rally 4% or more over the next few weeks, then some of the best performing sectors will strong gains in our favor. It depends on how strong these top-performing sectors react to the underlying momentum associated with each symbol though.
How to Avoid Emotional Trading Decisions
Trading based on emotions can lead to early, and sometimes foolish, entry and exits of positions. The market has a way of faking/shaking price which often prompt traders to react to the 2% to 4% swings in the markets as if they are catastrophic. Some of the best advice we can offer active traders other than becoming part of our trading group and pre-market analysis and trade alerts are…
_ Trust your system/strategy and follow it from entry to exit trigger.
_ Define your risks and run the strategy efficiently
_ Develop ways to identify and resolve strategy failure early and often
_ Trading involves risks – learn to execute the strategy within your risk parameters (position sizing)
_ Don’t let emotions control you. Trade rules should protect you during high & low volatility conditions.
If you don’t have a strategy and can’t see yourself sticking to these simple rules, then maybe it is time to find a better strategy or to attempt to develop some of these tactics into your existing strategy. You can follow me to success with my ETF Swing Trading Strategy, or our Options Trading Strategy at any time if you want all the work done for you.
Be sure to sign up for our free market trend analysis and signals now so you don’t miss our next special report!
Far too many people get lucky with a strategy then leverage their trading because they feel they will never fail. Failure of any strategy, often represented as the largest drawdown amount, should be multiplied by at least 3x when comparing risks. Just because your strategy showed one period of drawdown representing a -$5,500 loss does not mean that type of price activity is an isolated event. That type of drawdown could happen repeatedly, over a very short period of time, representing a -$16,500 loss.
The strongest strategy components are those that help to contain losses, manage risks and allow for the protection of capital. Remember, “living to trade another day” is far more important than huge gains off of one or two trades followed by a string he big losers that blow up your account.
In closing, get ready for a recovery in stock prices. With the indexes poised to move higher by another 3.5% – 5% before reaching the next 100% measured move suggests some sectors will post spectacular gains. Don’t let emotions dictate your decisions – run your strategy (or find a better strategy to trade with). The best performing sectors/symbols usually continue to outperform the US major indexes when trending higher.
Don’t miss the opportunities in the broad market sectors over the next 6+ months. 2021 and beyond are going to be incredible years for traders. What we expect to see is not the same type of market trend that we have experienced over the past 8+ years – this is a completely different set of market dynamics. You can sign up now for my FREE webinar that teaches you how to find, enter, and profit from only those sectors that have the most strength and momentum. Staying ahead of sector trends is going to be key to success in volatile markets.
For those who believe in the power of trading on relative strength, market cycles, and momentum but don’t have the time to do the research every day then my BAN Trader Pro newsletter service does all the work for you with daily market reports, research, and trade alerts. More frequent or experienced traders have been killing it trading options, ETFs, and stocks using my BAN Hotlist ranking the hottest ETFs, which is updated daily for my premium subscribers
Chris Vermeulen
www.TheTechnicalTraders.com
Chris Vermeulen has been involved in the markets since 1997 and is the founder of Technical Traders Ltd. He is an internationally recognized technical analyst, trader, and is the author of the book: 7 Steps to Win With Logic
Through years of research, trading and helping individual traders around the world. He learned that many traders have great trading ideas, but they lack one thing, they struggle to execute trades in a systematic way for consistent results. Chris helps educate traders with a three-hour video course that can change your trading results for the better.
His mission is to help his clients boost their trading performance while reducing market exposure and portfolio volatility.
He is a regular speaker on HoweStreet.com, and the FinancialSurvivorNetwork radio shows. Chris was also featured on the cover of AmalgaTrader Magazine, and contributes articles to several leading financial hubs like MarketOracle.co.uk
Disclaimer: Nothing in this report should be construed as a solicitation to buy or sell any securities mentioned. Technical Traders Ltd., its owners and the author of this report are not registered broker-dealers or financial advisors. Before investing in any securities, you should consult with your financial advisor and a registered broker-dealer. Never make an investment based solely on what you read in an online or printed report, including this report, especially if the investment involves a small, thinly-traded company that isn’t well known. Technical Traders Ltd. and the author of this report has been paid by Cardiff Energy Corp. In addition, the author owns shares of Cardiff Energy Corp. and would also benefit from volume and price appreciation of its stock. The information provided here within should not be construed as a financial analysis but rather as an advertisement. The author’s views and opinions regarding the companies featured in reports are his own views and are based on information that he has researched independently and has received, which the author assumes to be reliable. Technical Traders Ltd. and the author of this report do not guarantee the accuracy, completeness, or usefulness of any content of this report, nor its fitness for any particular purpose. Lastly, the author does not guarantee that any of the companies mentioned in the reports will perform as expected, and any comparisons made to other companies may not be valid or come into effect.
Chris Vermeulen Archive |
© 2005-2022 http://www.MarketOracle.co.uk - The Market Oracle is a FREE Daily Financial Markets Analysis & Forecasting online publication.


