


So, Where Is Gold's Corrective Upswing?
Commodities / Gold and Silver 2021 Mar 07, 2021 - 02:33 PM GMTBy: P_Radomski_CFA

Can the precious metals move lower before a short-term correction, and after correcting, will they continue their medium-term downtrend?
Gold & silver reversed yesterday (Mar. 2) and the GDX rallied after bottoming right in my previous target area, but it’s still unclear if the bottom is in.
Let’s check what’s happening in the charts.
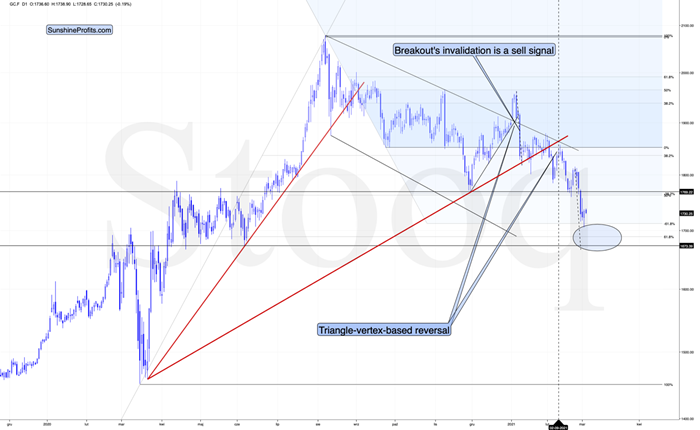
Figure 1 – COMEX Gold Futures (GC.F)
In short, gold reversed yesterday after touching the upper border or my target area. Can the temporary bottom be in? Yes. Is it likely to be in? Not necessarily. Most likely it’s not in yet, because gold still hasn’t moved to its strong support levels.
The size of the first part of the move sometimes tends to be identical or near-identical to the size of the final move. The size of the initial, August decline was almost just like the November decline. Now, copying the January 2021 decline to the current situation (blue, dashed lines), provides us with the target at about $1,675.
The above price area coincides with the previous 2020 lows, and it’s also slightly below the 61.8% Fibonacci retracement based on the entire 2020 upswing. Gold would be likely to at least reach this retracement before forming the temporary bottom.
Consequently, it would not be surprising to see gold suffering another ~$50 decline before finding a short-term bottom. More importantly though, if the initial move lower coincides with an S&P 500 correction, it would be likely to push mining stocks and silver lower in a more visible way.
On the bullish front, the shape of yesterday’s candlestick does indeed look like an intraday reversal. And we saw the same kind of intraday reversal in silver.
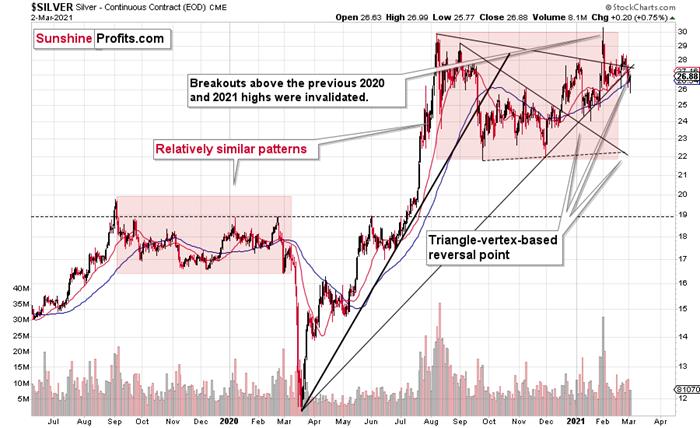
Figure 2 – COMEX Silver Futures
The fact that silver’s triangle-vertex-based reversal is approximately today / was approximately yesterday (it’s unclear) further validates the scenario, in which precious metals move higher in the short term.
I previously wrote that silver is likely to catch up with the decline at its later stage, while miners are likely to lead the way. That’s exactly what we’ve been seeing in the last few months. Silver is still likely to catch up with the declines when silver investors panic – just as they tend to do close to the end of given price moves (selling close to the bottom and buying close to the top). So far, miners remain the asset of choice for trading, but sometime during the next downswing, we might move to silver in order to magnify gains from both declines. As a reminder, please consider what happened on March 13 and March 16, 2020 and consider that the GDX ETF bottomed (in terms of the daily closing prices) on March 13. That was when silver was only in the middle of its decline.
Speaking of mining stocks, let’s take a look at the GDX ETF chart.
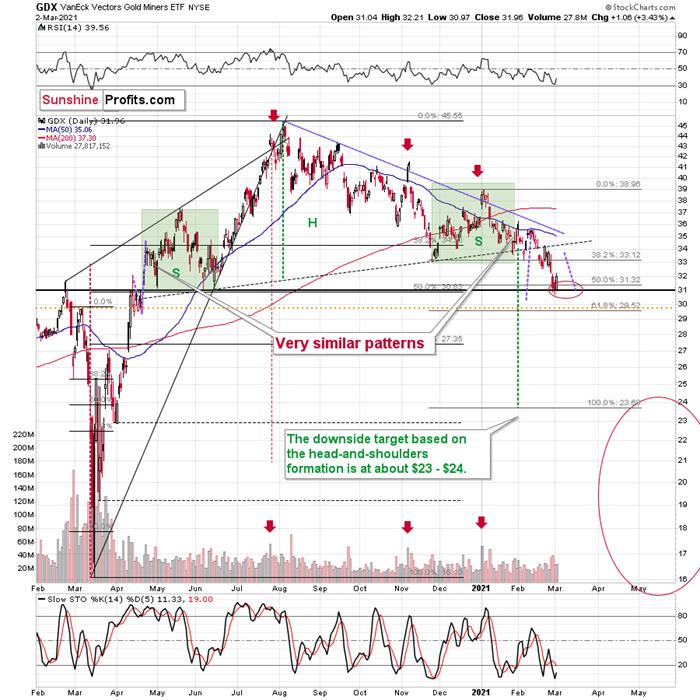
Figure 3 - VanEck Vectors Gold Miners ETF (GDX)
The GDX moved higher shortly after we successfully exited our short positions, relatively close to the bottom. But is this rally about to take miners much higher before they turn south once again? It’s unclear at this time.
It could be the case that we see an immediate move lower once again as gold declines to $1,675 or so, but it could also be the case that miners correct to $33 - $34 now, and then move to new lows later.
All in all, it seems that we are already seeing the corrective upswing, or one is about to start after another very short-term downswing. Once this corrective upswing is over, the downtrend is likely to resume.
Why would this be the case? There are myriads of reasons and I’m going over most of them each week in my flagship Gold & Silver Trading Alerts , but to name just a few, it’s gold’s invalidation of the breakout above its 2011 high, despite having an extremely positive fundamental picture, gold’s weak performance relative to the USD Index, miners’ relatively weak performance compared to gold, and the medium-term breakout in the USDX.
And speaking of the USD Index, let’s take a look at its chart.
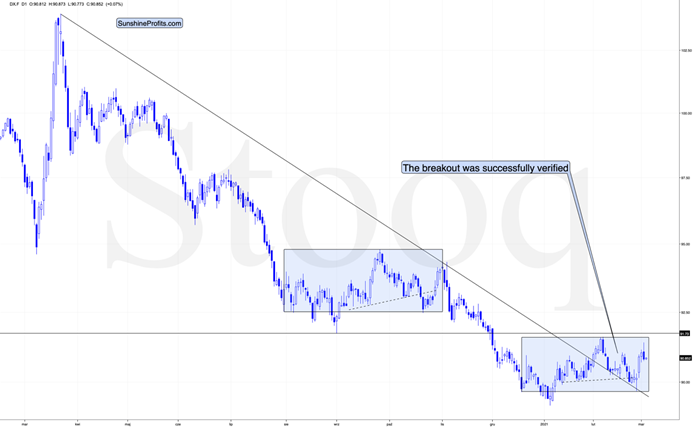
Figure 4
While the medium-term breakout continues to be the most important technical development visible on the above chart (with important bullish implications for the following months), there is one factor that could make the USD Index decline on a temporary basis.
This factor is the similarity to the mid-2020 price pattern. I previously commented on the head and shoulders pattern that had formed (necklines are marked with dashed lines), but that I didn’t trust. Indeed, this formation was invalidated, but a bigger pattern, of which this formation was part, wasn’t invalidated.
The patterns start with a broad bottom and an initial rally. Then it turns out that the initial rally is the head of a head-and-shoulders pattern that is then completed and invalidated. This is followed by a sharp rally, and then a reversal with a sizable daily decline.
So far, the situations are similar.
Last year, this pattern was followed by a decline to new lows. Now, based on the breakout above the rising medium-term support line, such a bearish outcome doesn’t seem likely, but we might see the pattern continue for several more days, before they disconnect. After all, this time, the USD Index is likely to really rally – similarly to how it soared in 2018 – and not move to new lows.
What happens before the patterns disconnect? The USD Index could decline temporarily.
This means that the temporary bottom in the precious metals and miners could have already formed, but it’s far from being crystal-clear.
All in all, markets tend to reverse only after reaching important support or resistance levels, which means that PMs and miners might still move lower before their short-term corrective upswing, but it could also be the case that the latter is already underway. Depending on how many confirmations we get of the bullish outlook, it might or might not be a good idea to enter temporary long positions here. After all, the medium-term downtrend started in August 2020 and it remains intact – thus, quick long positions are against the trend and thus riskier.
Thank you for reading today’s free analysis. Its full version includes details of our currently open position as well as targets of the upcoming sizable moves in gold, silver and the miners. We encourage you to sign up for our free gold newsletter – as soon as you do, you'll get 7 days of free access to our premium daily Gold & Silver Trading Alerts and you can read the full version of the above analysis right away. Sign up for our free gold newsletter today!
Thank you.
Przemyslaw Radomski, CFA
Founder, Editor-in-chief
Tools for Effective Gold & Silver Investments - SunshineProfits.com
Tools für Effektives Gold- und Silber-Investment - SunshineProfits.DE
* * * * *
About Sunshine Profits
Sunshine Profits enables anyone to forecast market changes with a level of accuracy that was once only available to closed-door institutions. It provides free trial access to its best investment tools (including lists of best gold stocks and best silver stocks), proprietary gold & silver indicators, buy & sell signals, weekly newsletter, and more. Seeing is believing.
Disclaimer
All essays, research and information found above represent analyses and opinions of Przemyslaw Radomski, CFA and Sunshine Profits' associates only. As such, it may prove wrong and be a subject to change without notice. Opinions and analyses were based on data available to authors of respective essays at the time of writing. Although the information provided above is based on careful research and sources that are believed to be accurate, Przemyslaw Radomski, CFA and his associates do not guarantee the accuracy or thoroughness of the data or information reported. The opinions published above are neither an offer nor a recommendation to purchase or sell any securities. Mr. Radomski is not a Registered Securities Advisor. By reading Przemyslaw Radomski's, CFA reports you fully agree that he will not be held responsible or liable for any decisions you make regarding any information provided in these reports. Investing, trading and speculation in any financial markets may involve high risk of loss. Przemyslaw Radomski, CFA, Sunshine Profits' employees and affiliates as well as members of their families may have a short or long position in any securities, including those mentioned in any of the reports or essays, and may make additional purchases and/or sales of those securities without notice.
Przemyslaw Radomski Archive |
© 2005-2022 http://www.MarketOracle.co.uk - The Market Oracle is a FREE Daily Financial Markets Analysis & Forecasting online publication.