Stocks, Gold – Rebound or Dead Cat Bounce?
Stock-Markets / Financial Markets 2021 Mar 04, 2021 - 01:08 PM GMTBy: Submissions
None of Friday‘s intraday attempts to recapture 3,850 stuck, and the last hour‘s selling pressure is an ill omen. Especially since it was accompanied by high yield corporate bondsh weakening. It‘s as if the markets only now noticed the surging long-end Treasury yields, declining steeply on Thursday as the 10y Treasury yield made it through 1.50% before retreating. And on Friday, stocks didn‘t trust the intraday reversal higher in 20+ year Treasuries either.
Instead, the options traders took the put/call ratio to levels unseen since early Nov. The VIX however doesn‘t reflect the nervousness, having remained near Thursday‘s closing values. Its long lower knot looks encouraging, and the coming few days would decide the shape of this correction which I have not called shallow since Wed‘s suspicious tech upswing. Here we are, the tech has pulled the 500-strong index down, and remains perched in a precarious position. Could have rebounded, didn‘t – instead showing that its risk-on (high beta) segments such as semiconductors, are ready to do well regardless.
That‘s the same about any high beta sector or stock such as financials – these tend to do well in rising rates environments. Regardless of any coming stabilization / retreat in long-term Treasury yields, it‘s my view that we‘re going to have to get used to rising spreads such as 2y over 10y as the long end still steepens. The markets and especially commodities aren‘t buying Fed‘s nonchalant attitude towards inflation. Stocks have felt the tremors, and will keep rising regardless, as it has been historically much higher rates that have caused serious issues (think 4% in 10y Treasuries).
In such an environment, the defensives with low volatility and good earnings are getting left behind, as it‘s the top earners in growth, and very risk-on cyclicals that do best. They would be taking the baton from each other, as (micro)rotations mark the stock market bull health – and once tech big names join again, new highs would arrive. Then, the $1.9T stimulus has made it past the House, involves nice stimulus checks, and speculation about an upcoming infrastructure bill remains.
Coupled with the avalanche of new Fed money, this is going into the real economy, not sitting on banks‘ balance sheets – and now, the banks will have more incentive to lend out. Margin debt isn‘t contracting, but global liquidity hasn‘t gone pretty much anywhere in February. Coupled with the short-term dollar moves, this is hurting emerging markets more than the U.S. - and based on the global liquidity metrics alone, the S&P 500 is oversold right now – that‘s without the stimulus package. It‘s my view that we‘re experiencing a correction whose shape is soon to be decided, and not a reversal of fortunes.
Just like I wrote at the onset of Friday:
(…) Would we get a bounce during the U.S. session? It‘s possible to the point of likely. The damage done yesterday though looks to have more than a few brief sessions to run to repair.
True, some stocks such as Tesla are at a concerning crossroads, and in general illustrate the vulnerability of non-top tech earners within the industry. Entering Mon‘s regular session, the signs are mixed as there hasn‘t been a clear reversal any way I look at it. Still, this remains one of the dips to be bought in my view – and the signs of it turning around, would be marked by strengthening commodities, and for all these are worth, copper, silver and oil especially.
As for gold, it should recover given the retreating long-term yields, but Fri didn‘t bring any signs of strength in the precious metals sector, to put it mildly. Look for TLT for directions, even as real rates, the true determinant, remain little changed and at -1%, which means very favorable fundamentals for the yellow metal. And remember that when the rate of inflation accelerates, rising rates start to bite the yellow metal less.
Let‘s move right into the charts (all courtesy of www.stockcharts.com).
S&P 500 and Its Internals
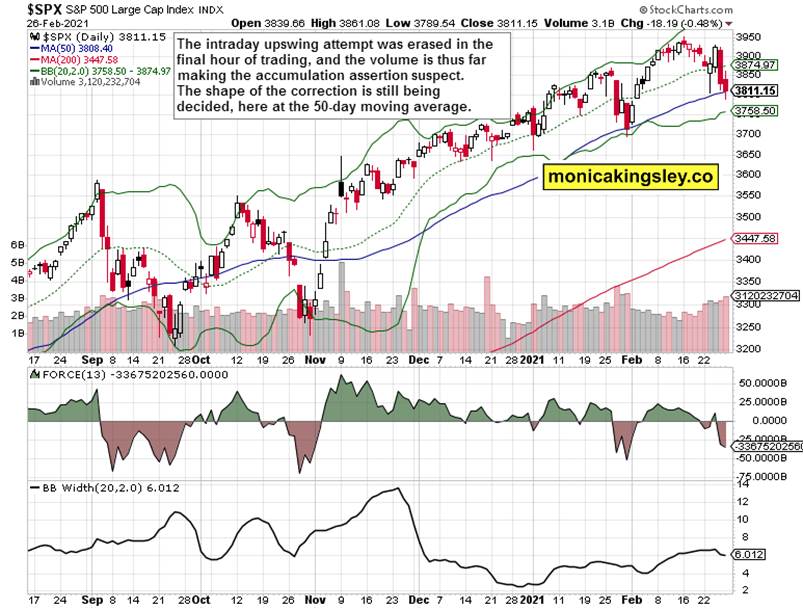
Friday‘s session doesn‘t have the many hallmarks of a reversal. Slightly higher volume, yet none of the intraday upswings held. The Force index reveals that the bears just paused for a day, that there wasn‘t a true reversal yet. The accumulation is a very weak one thus far, and the sellers can easily show more determination still.
Credit Markets
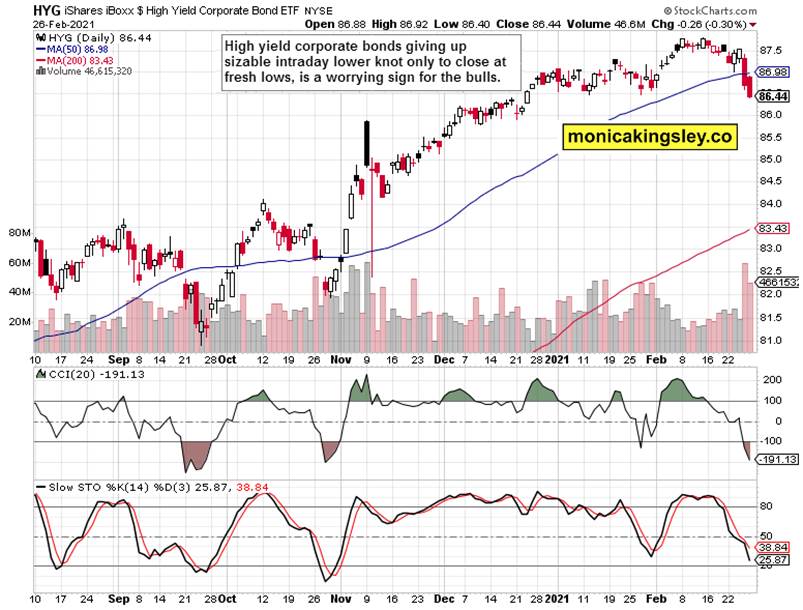
High yield corporate bonds (HYG ETF) are plain and simple worrying here. The decent intraday upswing evaporated as the closing bell approached. A weak session not indicative of a turnaround.
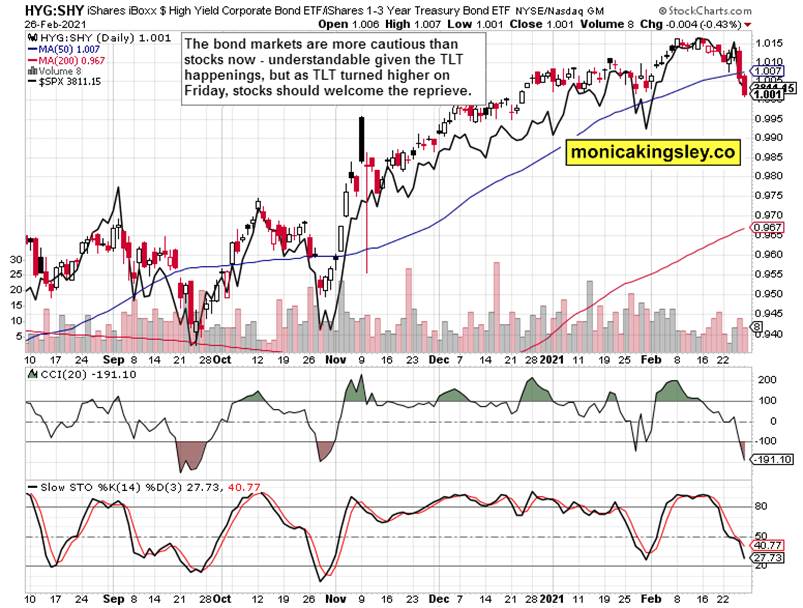
The high yield corporate bonds to short-dated Treasuries (HYG:SHY) performance was weaker than the stock market performance, which isn‘t a pleasant development. Should the bond markets keep trading with a more pessimistic bias than stocks, it could become quite fast concerning. As said already, the shape of the correction is being decided these days.
Stocks, Smallcaps and Emerging Markets
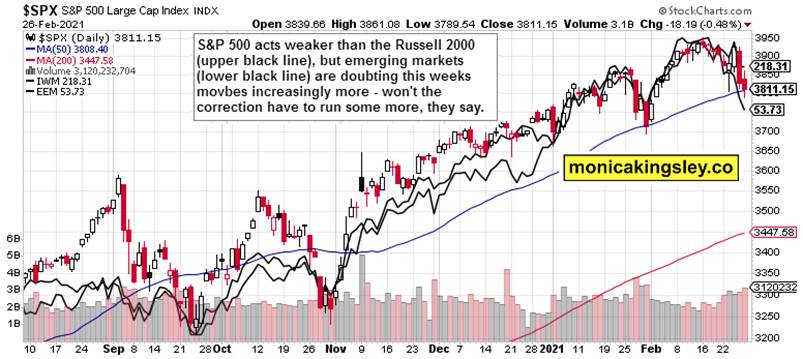
After having moved hand in hand, emerging markets (EEM ETF) have weakened considerably more over the prior week than both the S&P 500 and the Russell 2000 (IWM ETF). EEM is almost at its late Jan lows – given Fri‘s spike, watching the dollar is key, and not just here.
Technology
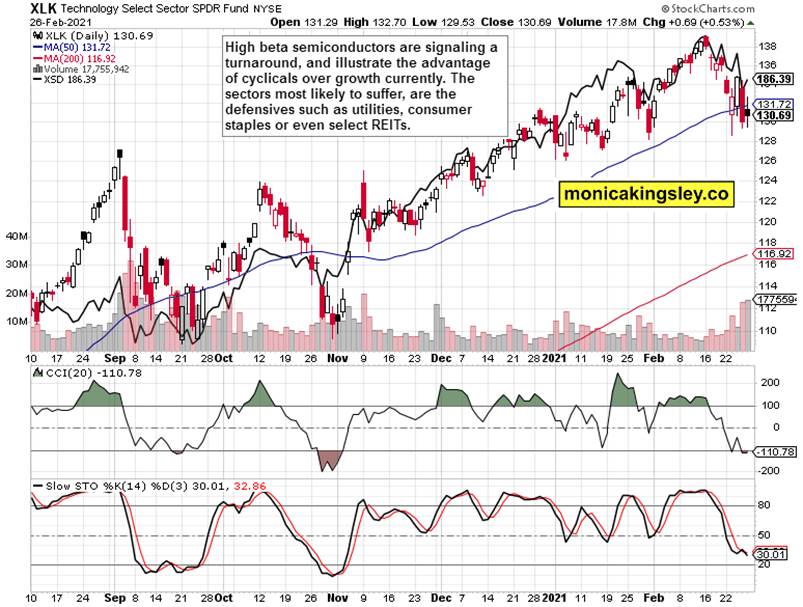
Technology (XLK ETF) didn‘t reverse with clarity on Friday, regardless of positive semiconductors (XSD ETF) performance. At least the volume comparison here is positive, and indicates accumulation. Just as I was highlighting the danger for S&P 500 and gold early Thursday, it‘s the tech sector that holds the key to the 500-strong index stabilization.
Gold and Silver
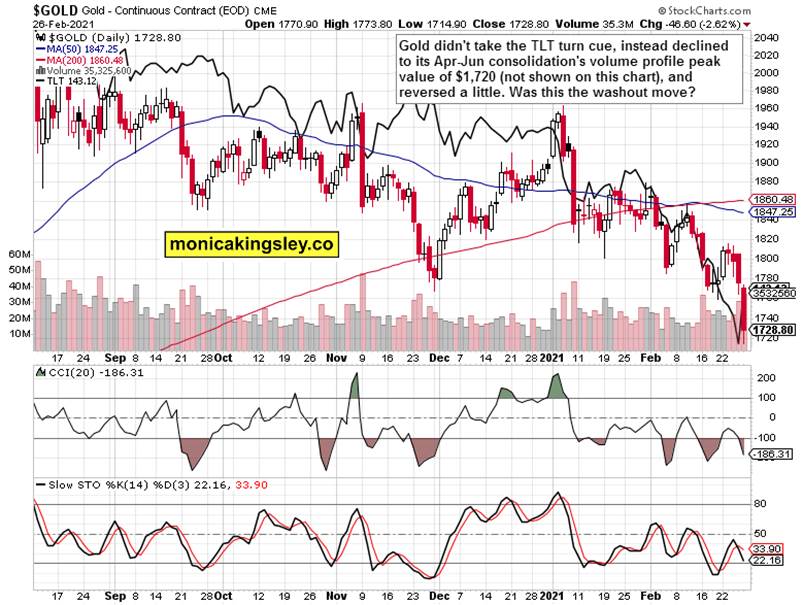
Real rates are deeply negative, long-dated Treasuries indeed turned higher on Friday, yet gold plunged right to its strong volume profile support zone before recovering a little. Its very short-term performance is disappointing, It was already its Tue performance that I called unconvincing – let alone Wed‘s one. I maintain that it‘s long-dated Treasury yields and the dollar that are holding the greatest sway. Rates should retreat a little from here, and the gold-dollar correlation is only slightly positive now, which translates into a weak positive effect on gold prices.
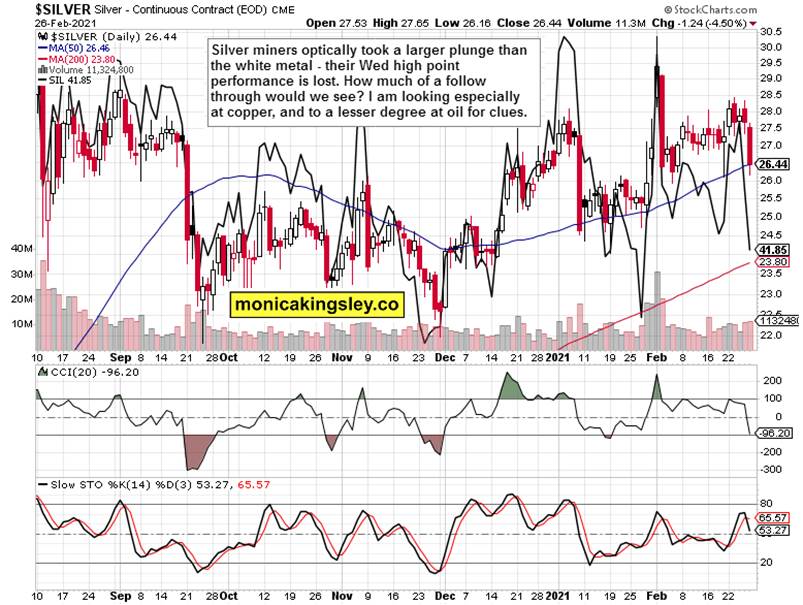
But it‘s silver that I am looking to for earliest signs of reversal – the white metal and its miners have the task clear cut. Weeks ago, I‘ve been noting the low $26 values as sufficient to retrace a reasonable part of prior advance, and we‘ve made it there only this late. Thu and Fri‘s weakness has much to do with the commodities complex, where I wanted still on Thu to see copper reversing intraday (to call it a risk-on reversal), which it didn‘t – and silver suffered the consequences as well. Likewise now, I‘m looking to the red metal, and will explain in today‘s final chart why.
Precious Metals Ratios
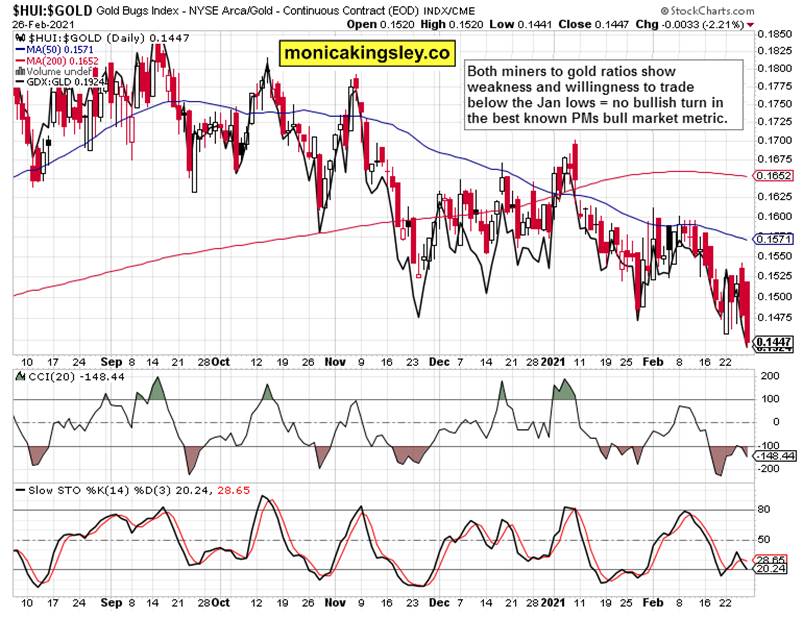
There is no better illustration of gold‘s weakness than in both miners to gold ratios that are bobbing around their local lows, rebounding soundly, and then breaking them more or less convincingly again. The gold sector doesn‘t yet appear ready to run.
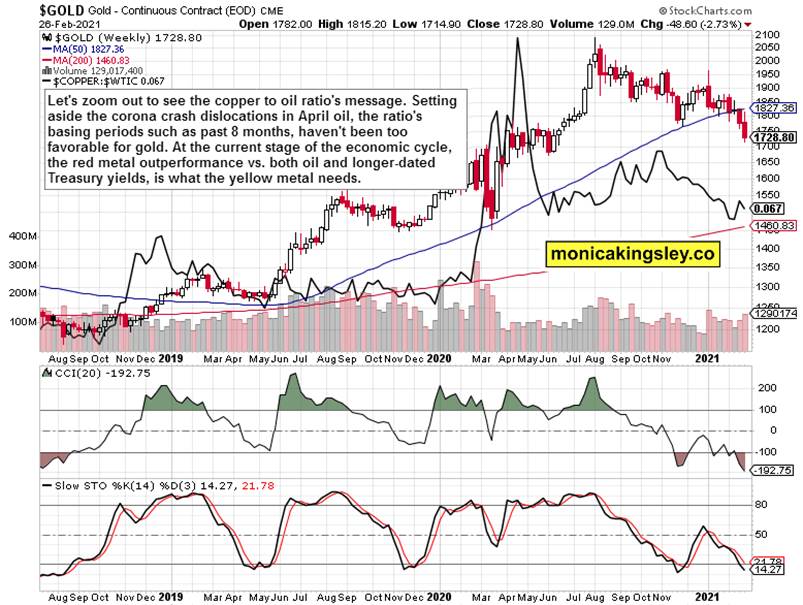
Let‘s get the big picture through the copper to oil ratio. Its current 8 months long consolidation has been punctured in the middle with oil turning higher, outperforming the red metal – and that brought the yellow one under pressure increasingly more. Yet is the uptick in buying interest in gold a sign of upcoming stabilization and higher prices in gold that Fri‘s beaten down values indicate? Notably, the copper to oil ratio didn‘t break to new lows – and remains as valuable tool to watch as real, nominal interest rates, and various derivatives such as copper to Treasury yields or this very ratio.
Summary
Gold and silver took an even greater beating on Fri than the day before. Naturally, silver is much better positioned to recapture the higher $27 levels than gold is regarding the $1,800 one. With the long-dated Treasuries stabilization indeed having resulted in a short-term dollar upswing, the greenback chart (and its effects upon the metals) is becoming key to watch these days. Restating the obvious, gold is far from out of the woods, and lacking positive signs of buying power emerging.
Thank you for having read today‘s free analysis, which is available in full at my homesite. There, you can subscribe to the free Monica‘s Insider Club, which features real-time trade calls and intraday updates for both Stock Trading Signals and Gold Trading Signals.
Thank you,
Monica Kingsley
Stock Trading Signals
Gold Trading Signals
www.monicakingsley.co
mk@monicakingsley.co
* * * * *
All essays, research and information represent analyses and opinions of Monica Kingsley that are based on available and latest data. Despite careful research and best efforts, it may prove wrong and be subject to change with or without notice. Monica Kingsley does not guarantee the accuracy or thoroughness of the data or information reported. Her content serves educational purposes and should not be relied upon as advice or construed as providing recommendations of any kind. Futures, stocks and options are financial instruments not suitable for every investor. Please be advised that you invest at your own risk. Monica Kingsley is not a Registered Securities Advisor. By reading her writings, you agree that she will not be held responsible or liable for any decisions you make. Investing, trading and speculating in financial markets may involve high risk of loss. Monica Kingsley may have a short or long position in any securities, including those mentioned in her writings, and may make additional purchases and/or sales of those securities without notice.
© 2005-2022 http://www.MarketOracle.co.uk - The Market Oracle is a FREE Daily Financial Markets Analysis & Forecasting online publication.


