


Revisiting the HUI Gold Bugs Stock Index
Commodities / Gold & Silver Stocks Oct 18, 2008 - 09:21 AM GMTBy: Joseph_Russo

 Proof is in the Pudding - Due to our intense focus on the major broad based equity indices, we discontinued coverage of the HUI more than a year ago. In going through some routine chart maintenance, we came across an old long-term chart of the HUI, left fully annotated, but unattended for more than a year.
We were not at all surprised to find that after dusting off this old chart that our forecasting guidance maintained ALL of its anticipatory accuracy without the need to make one single change to our count.
A year and a half ago, we provided readers with the article linked below…
From Navigating the HUI April 23, 2007
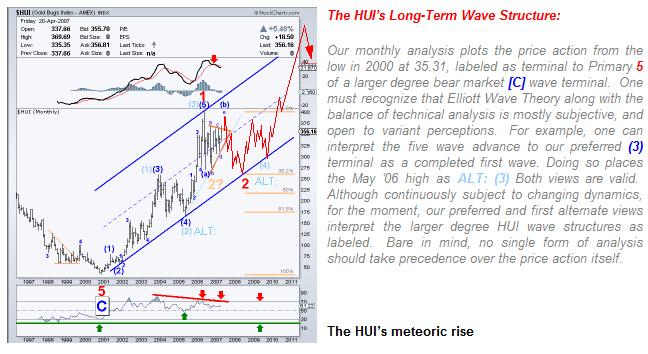
From its Cycle Degree print low of 35.31 in November of 2000- measured to its print high in May 2006 at 401.69, the HUI has skyrocketed more than 1037% in 5½ years! In contrast, the Gold price itself has only appreciated 192% in the same peak to trough period. In our view, the HUI's meteoric rise has topped, or remains in progress of terminating a first leg up of Primary dimension. Consolidations to date have yet to correct the 1037% Primary Degree advance in corresponding proportion. We suspect a proportionate correction may either take place later this year, or out as far as 2009 in confluence with a potential eight-year cycle low due in Gold.
CHART and Commentary to right FROM April 23, 2007
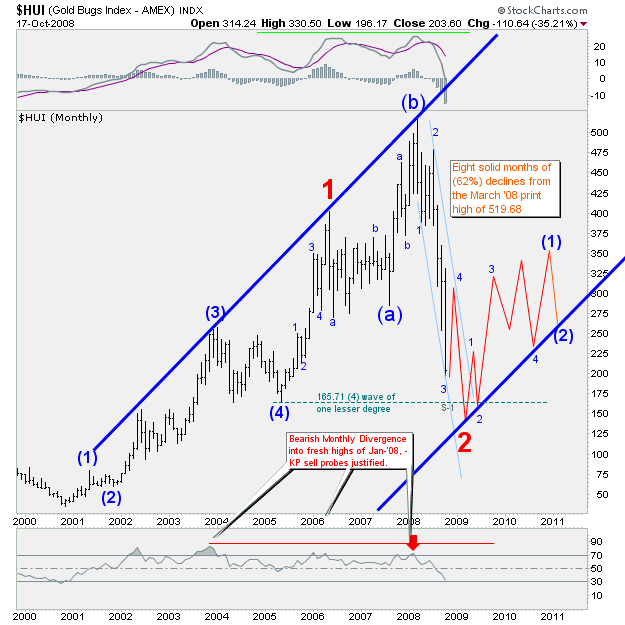
The chart from April of 2007 (above) updated with price data through October 18 (below) exemplifies the forecasting power of properly applied Elliott Wave dynamics.
Where is the bottom for the HUI?
The first price floor for the large 2 nd wave down resides at the (4) wave of one lesser degree at the 165.71 level. A second price magnet for wave 2 down is 175.27 or a 61.8% retracement of wave 1. If our count continues to maintain alignment with classic Elliott Wave tenets, the floor for Primary Wave 2 may go as low as, but should not exceed the 2000 print low of 35.31.
When it comes to strategically trading broad market indices, there is simply no match for Elliott Wave Technology's Near Term Outlook . We will gladly challenge any short-term advisory service or software generated algorithms that claim to outperform our consistent and impartial mapping of the price action in the Dow, S&P, or NDX.
Over the past three years, we have perfected the art of dispatching tactical trade set-ups and market forecasting to a consistent, impartial, and immensely profitable endeavor for those who take the time to embrace it.
The express focus of Elliott Wave Technology's charting and forecasting service is to help traders anticipate price direction and amplitude of broad market indices over the short, intermediate, and long-term.
We deliver this unique blend of proprietary charting protocol daily, with the express intent to convey timely and profitable information. Our daily reports impart strategy-specific guidance , which strives to forecast, monitor, and calibrate market impact relative to a multitude of signals that are in direct alignment with eight distinct trading strategies set forth in the members NTO essentials file.
Regardless of one's level of experience, users must allow sufficient time to become acquainted with the authors charting protocol, strategies, and tactical narratives prior to entering positions or developing discretionary trading strategies.
If you trade in today's increasingly uncertain and volatile markets, you need a reliable and consistent edge you can count on. If you want the very best, there is no better short-term advisory than the Near Term Outlook.
Trade Better / Invest Smarter...
By Joseph Russo
Chief Editor and Technical Analyst
Elliott Wave Technology
Email Author
Copyright © 2008 Elliott Wave Technology. All Rights Reserved.
Joseph Russo, presently the Publisher and Chief Market analyst for Elliott Wave Technology, has been studying Elliott Wave Theory, and the Technical Analysis of Financial Markets since 1991 and currently maintains active member status in the "Market Technicians Association." Joe continues to expand his body of knowledge through the MTA's accredited CMT program.
Joseph Russo Archive |
© 2005-2022 http://www.MarketOracle.co.uk - The Market Oracle is a FREE Daily Financial Markets Analysis & Forecasting online publication.