


The Financial and Economic Blue Screen of Death
Economics / Recession 2008 - 2010 Oct 18, 2008 - 08:57 AM GMTBy: John_Mauldin

 The Psyche of the American Consumer
 - The Consumer Weakens
- The Paradox of Thrift
- An Economic Blue Screen Of Death
- Those Wild And Crazy Analysts
This week I am in California giving two speeches to the Financial Planning Associations of San Diego and Orange County. This and next week's letters will be the broad outline of the speech. We will look at how the retreat of the American consumer will affect the stock market. Has the recent drop (can we say crash, gentle reader?) in stock market valuations given us an opportunity to find value? We look at some very powerful evidence that suggests that may be so. Then we look at the counter to that view. Are we at the bottom, or is there more pain? And given the current state of affairs, how should we then invest? Where do we put our money to work when the dust settles, as it surely will.
As I noted above, this will be a two-part letter, finishing up next week. It will also print out a lot longer than normal as I have a lot of PowerPoint slides that are really important for you to see. A note to the 25% of my one million-plus readers who are outside the US: I am using illustrations from the US stock market to discuss timing and valuations, but the principles will translate to markets worldwide. In fact, considering that most stock markets worldwide are down even more than the US markets, they may be even more applicable. The time to become bullish on a lot of markets may be closer than we think. Let's jump right in.
The Psyche of the American Consumer
You have to have a bit of humor, and I think this cartoon says a lot.

The psyche of the American consumer has been seared, and perhaps permanently, reminiscent of the manner in which our grandparents who lived during the Great Depression were permanently scarred with the memories of that time. How it works out will be different this time, of course, and we will explore that later on. But one thing that is very likely is a major impact on consumer spending going forward. Let's look at a few facts on the state of the consumer.
The Consumer Weakens
Retail sales have fallen for the last three months. This is the first time sales have fallen in such a manner since the record keeping began. They are falling at an annual rate of 2%, which is unprecedented.
Auto sales are down, virtually in freefall, with many auto company sales down more than 30% (Volvo is down 50%!). And it may get worse. GMAC, the financing arm of GM, has announced it will not lend to anyone whose credit score is not 700 or more! Only 58% of Americans qualify. That means, for a large swath of the consumer marketplace, cheap auto financing is a thing of the past, unless auto companies underwrite loans with guarantees.
However, what we are seeing is auto companies abandoning leasing programs and other traditional marketing avenues in order to search for elusive profits. Where you could buy a car two years ago for little or no money down, many dealers are now requiring an average of 12% down. While this makes sense, it is definitely a change.
And it is not just in the US. Auto sales throughout Europe are off significantly, especially in countries that had their own equivalent of the US housing bubble.
How bad is it? We are becoming a morose nation, staying at home to drown our sorrows - even bar sales are down, almost 1%. While I am sure this audience is doing its part to help out the bartenders of the world, our clients are not.
Falling consumer and retail sales are not surprising, given the fact that almost one million jobs have been lost in the last 12 months, bringing unemployment to 6.1%. California, which is a bellwether state, has seen its unemployment rise to 7.7%. That is a (sadly) reasonable target for nationwide unemployment. Back-of-the-napkin analysis suggests that means at least another million jobs will be lost this cycle.
Falling consumer sales are showing up in the share prices of retailers and shopping mall REITs. Many are down to prices last seen 12-16 years ago, with price drops far below the market averages. Think Vegas is immune? MGM and Trump, to name just two, are down 90%!
But we lost a lot of jobs in the last (2001-2002) recession, and consumer spending did not go down. Won't the present trend reverse soon? Might it not just be from the shock of the credit crisis? And with gasoline prices down, giving us a $100 billion plus "tax break," is the worst not over?
It is reasonable therefore to ask why it should be different this time. Predicting the demise of the American consumer has been a favorite pastime of bearish analysts for over 50 years. And they have always been wrong. The American consumer has proven resilient through feast and famine, war and peace. But, the data and circumstances suggest this time may be different.
Let's look at the data that came out this week on the delinquency rates of various types of consumer debt. The delinquency rate on auto loans is 3.8%, up from 2.9% two years ago. Consumer finance? Up to a very high 8.3%. Credit card delinquencies are 4.8%, rising from 4%. Is it any wonder credit card companies are cutting credit lines and raising interest rates to try and stem the bleeding? Mortgage delinquencies have doubled from 2.5% to a current 5%. Consumer credit in general is up to 5% delinquent, more than two-thirds higher than two years ago. This is all illustrative of a consumer in trouble.
Look at this next chart from John Burn Real Estate Consulting. He surveys hundreds of homebuilders nationwide. The long and short of it is that new home sales forecasts are at all-time lows. Traffic (potential buyers) looking at new homes is dismal. In my own area in Dallas, there are brand new homes which builders are willing to lease at very attractive rates in order to generate some cash flow, at much less than the cost of buying. And given the level of prospective buyers looking for a new home, that is a trend likely to continue.
I should note that this morning housing permits fell to a 26-year low, around 786,000. But that statistic can be misleading. Back in 1982, the population of the US was 230 million. Today it is 305 million. We are roughly one-third larger. If you adjust for population, the number would be in the 600,000 range, which is far worse than a mere 26-year low. Those permits mean jobs, and permits need to rise with the population to maintain the job base.
And since we're looking at today's data, the Michigan consumer sentiment number simply fell off a cliff, plunging to 57 from over 70 last month and an average of 85 last year. It was only a few years ago that the number was over 100. The last time it was this low? We were in the midst of a very serious recession in 1982.
Let's get back to housing. This next chart is from www.dismal.com , showing the fall-off in mortgage applications. Mortgage applications for purchase are down by over 30% since the end of 2007, and down much more than that from the peak of 2006, as the subprime lending market has disappeared.
Let's pay particular attention to the fall-off in applications for re-financing, down by almost 60%. This was the source of mortgage equity withdrawals, which fueled consumer-spending growth even in the face of the last recession. Let's look at a graph I used two years ago, from work done by James Kennedy and Alan Greenspan, on the effect of mortgage equity withdrawals (MEWs) on the growth of the US economy.
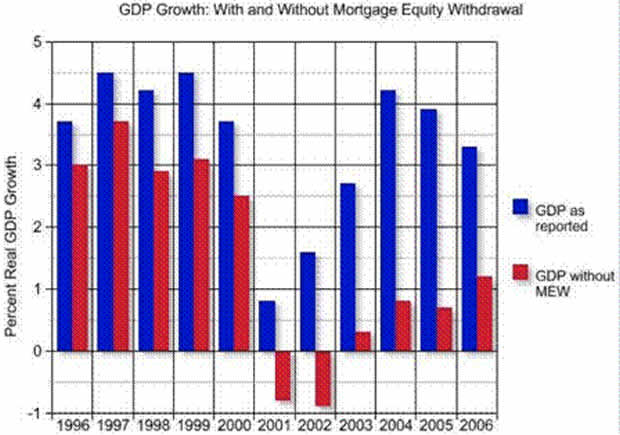
Notice that in both 2001 and 2002, the US economy continued to grow on an annual basis (the "technical" recession was just a few quarters). Their work suggests that this growth was entirely due to MEWs. In fact, MEWs contributed over 3% to GDP growth in 2004 and 2005, and 2% in 2006. Without US homeowners using their homes as an ATM, the economy would have been very sluggish indeed, averaging much less than 1% for the six years of the Bush presidency. Indeed, as a side observation, without home equity withdrawals the economy would have been so bad it would have been almost impossible for Bush to have won a second term.
Now let's look at the update that James Kennedy posted last week to his numbers. While he does not have an update to the chart above, we do have the actual numbers for new mortgage equity withdrawals through the second quarter of this year. And what they show is MEWs simply withering on the vine. The engine of our GDP growth has essentially been turned off. Look at the fall in the numbers for yourself:
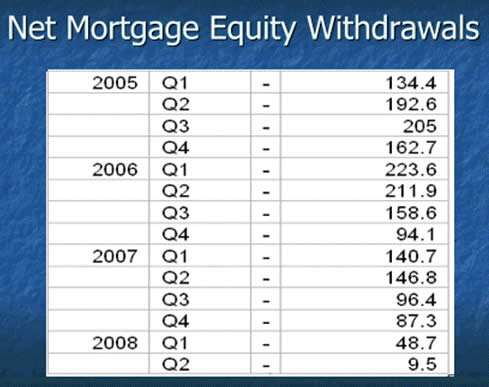
In 2005 there was almost $595 billion in mortgage extractions that went into some kind of consumer spending. Remember, according to the graph above, that translated into a 3% rise in GDP. In 2007, MEWs were down to $470 billion, for a boost of 2% to GDP.
The second quarter of 2008 saw an anemic $9.5 billion. At that run rate, we could see a drop-off of over 90% from 2005! Now, think what the second quarter would have been without the federal stimulus program of $150 billion. It might have looked and felt like this quarter!
While credit card growth has indeed risen to take up some of the "slack," it is nowhere near the previous levels of MEWs. With almost 20% of American mortgages either now or soon to be "under water," and because lending standards are tightening, it will be a long time before we see a significant upsurge in home equity withdrawals. Whatever growth we see in the next few years will have to come from old-fashioned sources, like real productivity and reality-based lending. Homeowner hallucinations are a thing of the past.
And for those of you who like to digest your numbers visually, here is the chart of the decrease in MEWs.
It is likely that whatever recovery we see will be slow in coming. Without MEWs, the period from 2001-2007 would have seen GDP growth of less than 1%! What has changed for the better? It is going to be a rather serious recession and a slow Muddle Through recovery of several years. Unless Obama, Pelosi, and Reid push through their tax increase. Then it will be a lot longer. Maybe even a repeat of 1980 and 1982, where we had back-to-back recessions in two years. Increasing taxes in a recession is the worst possible economic policy. You increase taxes, from an economic perspective, in good times.
Last year, I predicted we would see three things as a result of the bursting of the housing and credit crisis bubbles:
1. We are in a period where earnings disappointments are going to be the rule, not the exception.
2. Lower corporate profits puts pressure on the stock market,
3. Resulting in lower than expected long-term returns.
Let me add a fourth. The psyche of the American consumer has been seared, and perhaps permanently.
The Paradox of Thrift
We are (finally!) going to see US consumers start to increase their savings. Increasing home prices and increasing stock prices made many consumers feel comfortable that their retirement future was assured. Now that feeling has been crushed. Home values are not likely to bounce back for a very long time. And as I have written for a long time, we are facing a low-return environment for stocks.
Now, while it is a good thing for an individual to save money, it is not good for the economy as a whole, at least in terms of consumer spending and GDP growth. This is the Paradox of Thrift.
An Economic Blue Screen Of Death
The lack of the ability to borrow on homes, coupled with the need to save more money, is going to put a large dent in the US and world economy. My older readers will remember the Microsoft "blue screen of death" that would pop up from time to time when your computer froze. All you could do was hit the reset button. It is as if we have hit a giant economic blue screen of death. All we can do is hit the reset button. We are going to a new, lower level of consumer spending on an absolute basis, and perhaps as a percentage of GDP. Once that new level has been reached, we will start slowly growing from there; but until that point, the growth of the US economy is going to be severely challenged. We got ahead of ourselves through borrowing and confidence in the bull market, and now we have to deal with the new reality.
That means corporate earnings for many US companies are going to come under increased pressure. And as we will see below, the drop in corporate earnings is in line with the drop in the stock market.
Those Wild And Crazy Analysts
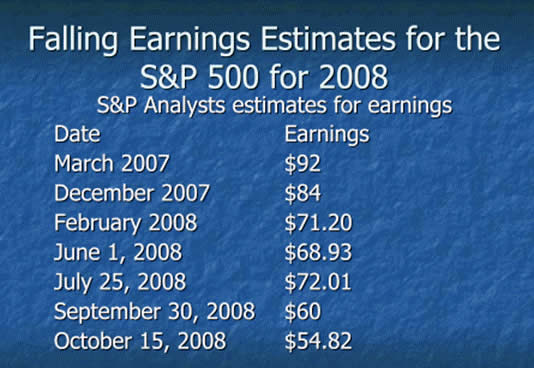
Look at how the projections for earnings per share for the S&P 500 have dropped over the past year. Every few months, estimates have dropped. It will get worse (teaser for next week: we look at graphs which show where earnings may go if they drop as much as in the last recession. And remember, that recession had growing consumer spending!).
Given the malaise and mood of the US consumer, the already low numbers for this year are likely to be revised down again. Let's go to the chart:
Now let's look at 2009 projections.
Notice that in February of 2008, earnings for 2008 had been revised downward to $71.20. But analysts were still bullish. They projected the next month an almost 10% increase in earnings for 2009. They are now down to $48. Remember the old Limbo song, "How Low Can You Go?" 2009 earnings can go a lot lower.
One last graph for this week and then we will call it a day. This is the actual data from S&P, which I copied from their web site. Notice the huge disparity between the as-reported earnings and operating earnings estimate for 2009. The operating earnings are literally double the reported earnings. Reported earnings are what companies use for tax purposes. They are also the basis for any historical comparisons you see. Operating earnings are what I call EBBS or Earnings Before Bad Stuff, or whatever term you use for BS.
The operating earnings estimates are "bottom up" (no pun here). That means that S&P gets the estimates from each of the analysts that follow the individual companies, and add them up for the estimate. The top-down estimates take into account economic conditions. It makes a HUGE difference as to who is more accurate. If the optimists are right, we are at single-digit price to earnings ratios (around 8). If the as-reported team is right, we are at relatively high levels, even after the recent large drop. How high? As of 11 AM Pacific, the 2009 P/E projected ratio is 20.2. That is not a level from which major bull markets are launched.
But is that the level we should be looking at? As we will see next week, if you take a longer-term view of a few years, you can make a case that we are getting closer to a secular bear price-cycle low. Next week, we look at how secular bear markets work and where we could go, and then I offer a few areas where you can look to place your portfolio. I am getting closer to the time when I can be cautiously optimistic.
We will get through this current crisis, and the falls in prices of assets of all types are beginning to create some real opportunities. We will explore those thoughts and a lot more next week.
London, Stockholm, Malta, and Becoming a Grandfather
As noted at the beginning of the letter, I am in California, but will fly home this afternoon. Tomorrow I explore some of the local Dallas housing values (leasing) and then fly on to London in the late afternoon, meeting with my London partners, Absolute Return Partners for a fast few days, and then on to Stockholm where I speak and will chair the day's events for Kaupthing Bank, which was a branch of the Icelandic bank a few weeks ago but now has been taken over by the Swedish government. I expect to learn a lot. And I get to spend some time with old friend Marc Faber. The original focus for the day, many months ago, was "Investing in an Age of Scarcity," but we will expand the topics covered with a nod to current affairs.
Then an ungodly early wake-up call, and on to Malta on Friday, where I will be involved in a series of board meetings of various hedge funds. Even more interesting. Saturday I start to work my way back to Dallas, and then I am mostly home for the next three months, where I will be researching and writing with Tiffani our new book, called Eavesdropping on Millionaires. We have been interviewing millionaires from all levels and from all over the world, but their stories have some common threads. This has had a huge impact on both Tiffani and me. I hope we can convey in the book what we are learning. It is changing my outlook and habits, I can tell you.
I got a text message late last night from my oldest son Henry. He assumed I was already asleep, but I was still up working. He wrote: "I know you wanted us to wait a little longer, but you are going to be a grandpa." He wrote a few more nice thoughts, along the line of wanting my advice and wisdom, etc. Like I have a clue. I feel supremely lucky that my (7!) kids have turned out so well. And we all enjoy and love one another, and I get to spend time with them as young adults. And I guess almost 60 is not be that bad to be a first-time grandfather. Should be an interesting and fun new chapter in my life, if my many friends who have traveled that road are any indication.
It is time to hit the send button. I have this speech to do in an hour, and my really good friend Rob Arnott is coming to have lunch. Life is a lot of fun. Enjoy your week and remember that friends, family, and health are where our true wealth is.
Your thinking more about the Big Stuff analyst,
By John Mauldin
John Mauldin, Best-Selling author and recognized financial expert, is also editor of the free Thoughts From the Frontline that goes to over 1 million readers each week. For more information on John or his FREE weekly economic letter go to: http://www.frontlinethoughts.com/learnmore
To subscribe to John Mauldin's E-Letter please click here:http://www.frontlinethoughts.com/subscribe.asp
Copyright 2008 John Mauldin. All Rights Reserved
John Mauldin is president of Millennium Wave Advisors, LLC, a registered investment advisor. All material presented herein is believed to be reliable but we cannot attest to its accuracy. Investment recommendations may change and readers are urged to check with their investment counselors before making any investment decisions. Opinions expressed in these reports may change without prior notice. John Mauldin and/or the staff at Millennium Wave Advisors, LLC may or may not have investments in any funds cited above. Mauldin can be reached at 800-829-7273.
Disclaimer PAST RESULTS ARE NOT INDICATIVE OF FUTURE RESULTS. THERE IS RISK OF LOSS AS WELL AS THE OPPORTUNITY FOR GAIN WHEN INVESTING IN MANAGED FUNDS. WHEN CONSIDERING ALTERNATIVE INVESTMENTS, INCLUDING HEDGE FUNDS, YOU SHOULD CONSIDER VARIOUS RISKS INCLUDING THE FACT THAT SOME PRODUCTS: OFTEN ENGAGE IN LEVERAGING AND OTHER SPECULATIVE INVESTMENT PRACTICES THAT MAY INCREASE THE RISK OF INVESTMENT LOSS, CAN BE ILLIQUID, ARE NOT REQUIRED TO PROVIDE PERIODIC PRICING OR VALUATION INFORMATION TO INVESTORS, MAY INVOLVE COMPLEX TAX STRUCTURES AND DELAYS IN DISTRIBUTING IMPORTANT TAX INFORMATION, ARE NOT SUBJECT TO THE SAME REGULATORY REQUIREMENTS AS MUTUAL FUNDS, OFTEN CHARGE HIGH FEES, AND IN MANY CASES THE UNDERLYING INVESTMENTS ARE NOT TRANSPARENT AND ARE KNOWN ONLY TO THE INVESTMENT MANAGER.
John Mauldin Archive |
© 2005-2022 http://www.MarketOracle.co.uk - The Market Oracle is a FREE Daily Financial Markets Analysis & Forecasting online publication.