The Stocks Bull Market is Only Half Completed
Stock-Markets / Stock Market 2021 Jan 04, 2021 - 05:08 PM GMTBy: Donald_W_Dony
After over 11 years of continuous advancement, the bull market is finally starting to show signs of its age.
Historically, secular bull markets tend to last about 18 years. This was the case for the prior three bull markets.
From 1919 to 1930 and from 1949 to 1970 and again from 1982 to 2000, the U.S. stock market unrelentingly rose despite fundamental and economical challenges.
The current bull market has also faced a number obstacles over the past 11 years. But similar to past secular bulls, shows no signs of altering its upward path.
One signal that helps define the duration of the bull market occurred in mid-2020.
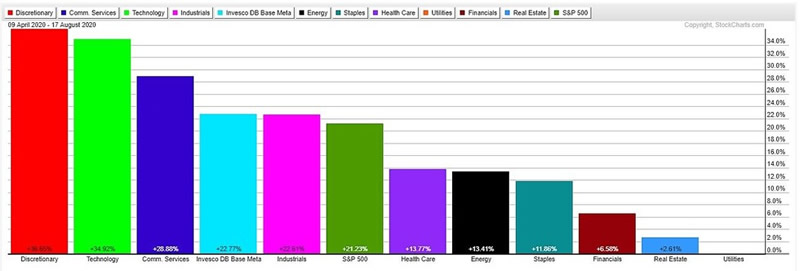
The S&P Base Metals and Materials sector began to outperform the S&P 500 in mid-year (Chart 1).

This important industry group typically starts to out pace the stock market (S&P 500) early on in the second half of the bull market.
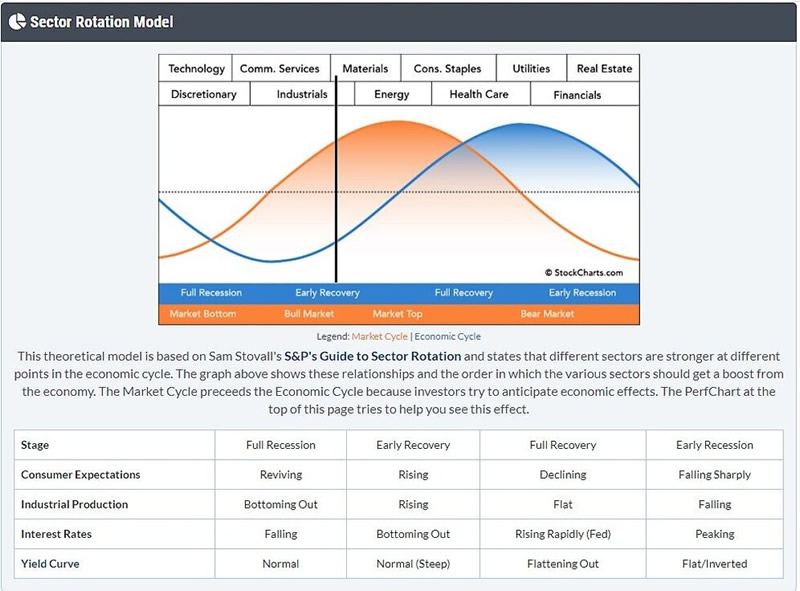
When the Metals and Materials sector started outperforming the S&P 500 in Q2, it established a "marker" for the remaining duration of the bull market (Chart 2).

Also, the economic characteristics at this stage of the market's advance fits in well to the expected elements during the recovery phase. Both Consumer expectations and Industrial production are now rising. Interest rates are bottoming out and the U.S. Yield curve is in a normal steep angle. All elements that are occurring at this time.
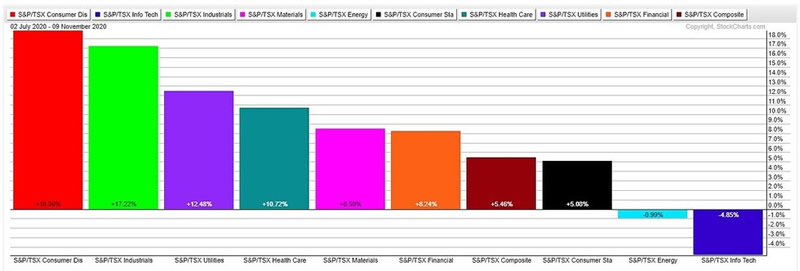
Canada's TSX developed the same pattern as the S&P 500. The Materials sector began to outperform the TSX in Q3 (Chart 3).

Bottom line: The rise in performance of the metals and material sectors in the S&P 500 and TSX likely marks an important junction for the duration of the current bull market. This specific industry group typically starts to outperform its underlying index just past the halfway point of a secular bull market.
And as the historical duration of a bull market lasts about 18 years, this market advance is expected to continue for another six to seven more years.
By Donald W. Dony, FCSI, MFTA
www.technicalspeculator.com
COPYRIGHT © 2020 Donald W. Dony
Donald W. Dony, FCSI, MFTA has been in the investment profession for over 20 years, first as a stock broker in the mid 1980's and then as the principal of D. W. Dony and Associates Inc., a financial consulting firm to present. He is the editor and publisher of the Technical Speculator, a monthly international investment newsletter, which specializes in major world equity markets, currencies, bonds and interest rates as well as the precious metals markets.
Donald is also an instructor for the Canadian Securities Institute (CSI). He is often called upon to design technical analysis training programs and to provide teaching to industry professionals on technical analysis at many of Canada's leading brokerage firms. He is a respected specialist in the area of intermarket and cycle analysis and a frequent speaker at investment conferences.
Mr. Dony is a member of the Canadian Society of Technical Analysts (CSTA) and the International Federation of Technical Analysts (IFTA).
Donald W. Dony Archive |
© 2005-2022 http://www.MarketOracle.co.uk - The Market Oracle is a FREE Daily Financial Markets Analysis & Forecasting online publication.


