


Stock Market Price Amplitude Arcs/Gann Suggest A Major Peak in Early April 2021
Stock-Markets / Stock Markets 2020 Dec 31, 2020 - 03:48 PM GMTBy: Chris_Vermeulen

W.D. Gann mastered price trends (angles/slope) and time in relation to predicting future price trends and peaks/troughs. Over the years, my team and I have done some research related to W.D. Gann’s theories and have come to a simple understanding of some of these concepts. In this article, we will review his primary theory that past price trends may help to predict future price peaks using angles/slopes and time factors.
Monthly SPY Chart Showing Key Price Trendline
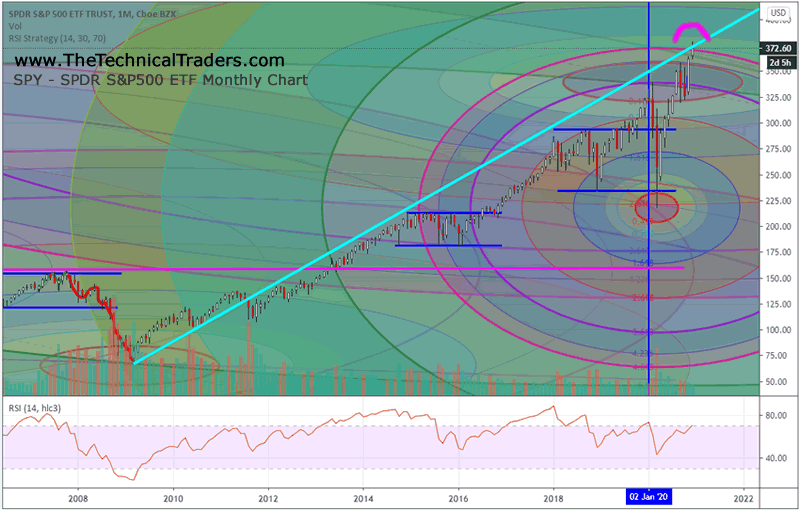
After the bottom in 2009 at the peak of the Credit Crisis, a new upward price trend set up a very clear price slope by tracking the lows from 2009 through 2010. We’ve drawn a CYAN colored line across those lows on the Monthly SPY chart (below). As we follow this trend through the 2011 to 2020 price activity, you can see this trendline was breached in late 2011 – where this upward sloping trendline became a resistance level going forward. In 2015, price briefly touched this CYAN trendline, and just recently, in 2020, price again touched and breached this trendline.
Our understanding of Gann’s theory is that these angles/slopes/trendlines are important in understanding where price may target future peaks or troughs. But it is more important to understand how price reacts to these future peaks/troughs and IF price confirms the expected actions when they reach these peaks/troughs. With price briefly breaching the CYAN trendline, we are asking ourselves “if price fails after reaching levels above this trendline, does this confirm as a major price peak or not”?
You can also see our proprietary Fibonacci Price Amplitude Arcs drawn on the chart above. We believe these are aligned with price energy frequencies and help us to understand where and when price inflection points may occur. It may be difficult for you to see the multiple Fibonacci Price Amplitude Arcs that align near the current price high, but there are three unique Fibonacci Price Amplitude arcs spanning this peak.
- The $373.92 Arc aligning from the February 18, 2020 peak
- The $370.30 Arc aligning from the March 23, 2020 bottom
- The $364.04 Arc aligning from the March 20, 2000 peak
We believe it is important to see how price reacts to the current potential peak setup after reaching the CYAN upward sloping price channel/line near these inflection points. If price fails to establish any support above the $379~380 price level on the SPY, then a technical failure will have set up – likely prompting a moderately strong downside price trend in the near future.
Be sure to sign up for our free market trend analysis and signals now so you don’t miss our next special report!
Our understanding of Gann price trends and their future predictions is that price may attempt to target/reach levels predicted by these slopes/trends in the future. Having said that, it is critical to understand what price does when it reaches these levels and why.
In some ways, our Fibonacci Price Amplitude Arcs may be similar to Gann’s Law of Vibration concept – where price trends originate in the rotational/vibrations of price itself. Here, price is consistently acting in a manner that portrays the underlying energy frequency/amplitude/vibration waves driving the trends. Think of these as multiple price/time/energy waves that perpetuate price trends, peaks, troughs, and various structures in price over multiple time-frames. Gann’s study of price was not limited to one aspect of time/price as he applied his theories across many time-frames and price elements.
Many traders already know that W.D. Gann predicted that the end of the great bull market would happen on September 3, 1929, and that a panic selling would take place afterward. He was spot on. Throughout his life, Gann authored many books and attempted to share the knowledge he gained by attempting to explain how the “Law of Vibration” was the “Master Key” to understanding all aspects of natural life and mathematics. You can learn more about Gann and his work at http://time-price-research-astrofin.blogspot.com/p/wd-gann.html.
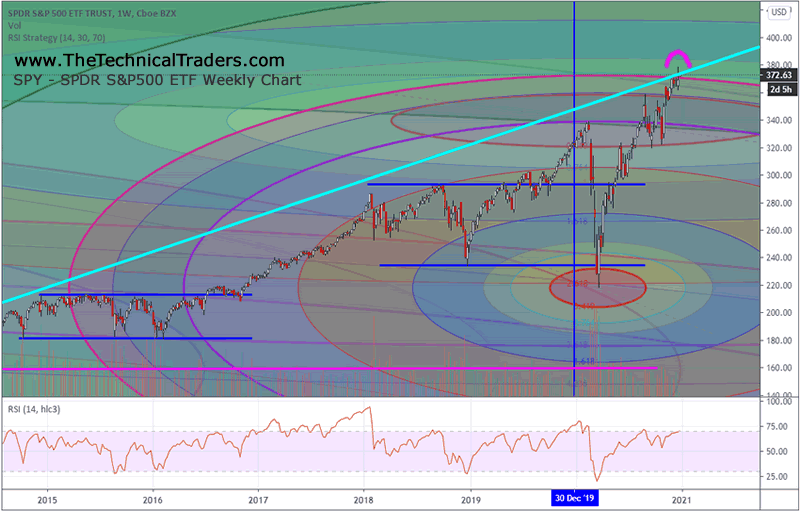
Weekly SPY Chart Showing Key Price Trendline
The following Weekly chart of the SPY highlighting the key upward sloping trend line suggests that what happens with price at this current critical price level will likely determine the future trends and outcome for investors. We have not applied any time factoring onto this chart yet, we are simply applying trend slope analysis to this chart and suggesting this critical breach of the upward sloping price channel (CYAN line) is aligned with W.D. Gann’s theories and may serve as a very timely warning about future price trends and corrections for skilled traders. If price fails to rally above the CYAN level and/or sets up a broader market top over the next few weeks and months, this trendline setup may become very relevant.
In the second part of this research article, we will apply Gann Price/Time cycles to our research to show you exactly where and how the April 2021 price peak may setup. The possibility that our Fibonacci Price Amplitude Arcs align with W.D. Gann’s Law of Vibration theory and may work together to help us unlock major price inflection points is simply incredible. For our research team, it suggests that we are on the cusp of being able to see more accurate and timely data for our members and to be able to prepare for and trade some of the biggest trends that setup.
Are you ready for this major potential peak in the markets? Do you know how to trade the next 60 to 90+ days to protect your assets and find profits from the best assets to own? Learn how our BAN, Best Asset Now, technology can help you find and execute better trades. Visit www.TheTechnicalTraders.com to learn more.
Enjoy the rest of this short week!
Chris Vermeulen
www.TheTechnicalTraders.com
Chris Vermeulen has been involved in the markets since 1997 and is the founder of Technical Traders Ltd. He is an internationally recognized technical analyst, trader, and is the author of the book: 7 Steps to Win With Logic
Through years of research, trading and helping individual traders around the world. He learned that many traders have great trading ideas, but they lack one thing, they struggle to execute trades in a systematic way for consistent results. Chris helps educate traders with a three-hour video course that can change your trading results for the better.
His mission is to help his clients boost their trading performance while reducing market exposure and portfolio volatility.
He is a regular speaker on HoweStreet.com, and the FinancialSurvivorNetwork radio shows. Chris was also featured on the cover of AmalgaTrader Magazine, and contributes articles to several leading financial hubs like MarketOracle.co.uk
Disclaimer: Nothing in this report should be construed as a solicitation to buy or sell any securities mentioned. Technical Traders Ltd., its owners and the author of this report are not registered broker-dealers or financial advisors. Before investing in any securities, you should consult with your financial advisor and a registered broker-dealer. Never make an investment based solely on what you read in an online or printed report, including this report, especially if the investment involves a small, thinly-traded company that isn’t well known. Technical Traders Ltd. and the author of this report has been paid by Cardiff Energy Corp. In addition, the author owns shares of Cardiff Energy Corp. and would also benefit from volume and price appreciation of its stock. The information provided here within should not be construed as a financial analysis but rather as an advertisement. The author’s views and opinions regarding the companies featured in reports are his own views and are based on information that he has researched independently and has received, which the author assumes to be reliable. Technical Traders Ltd. and the author of this report do not guarantee the accuracy, completeness, or usefulness of any content of this report, nor its fitness for any particular purpose. Lastly, the author does not guarantee that any of the companies mentioned in the reports will perform as expected, and any comparisons made to other companies may not be valid or come into effect.
Chris Vermeulen Archive |
© 2005-2022 http://www.MarketOracle.co.uk - The Market Oracle is a FREE Daily Financial Markets Analysis & Forecasting online publication.