


Bitcoin Price Next Stop: $14,000 or $37,200
Currencies / Bitcoin Dec 07, 2020 - 02:33 PM GMTBy: Chris_Vermeulen

After the incredible rally in Cryptos recently and my team’s recent research articles about how to spot a “Blow-Off Peak”, the recent downturn in Bitcoin prices has raised a valid question – is this the start of a new “Blow-Off Top” for Bitcoin? In our recent 2-part research article on Blow-Off Tops, we suggested there are five phases to a Blow-Off top setup. The first is an incredible rally attempt – usually somewhat similar to a parabolic price advance. We can certainly say that Bitcoin has seen a huge price advance from near $4000 in early March to over $19,000 recently (+$15,000). Is this it? Is this a major price peak or will it continue higher?
When taken in the context of what has transpired over the past 12+ months with COVID-19 and various global lock-downs, it does make sense that many more displaced workers across the globe may have become actively involved in Cryptos and alternate assets. It also makes sense that a rush into the recent upside trending in Bitcoin, starting near early October 2020, may have prompted a rush for Crypto traders/investors. Everyone loves it when their investments rally 80% or more in less than 60 days.
Yet the question remains – will Bitcoin go higher or is this the intermediate-term peak in price? Historically, the recent highs are similar to the highs set in December 2017: $19,666 in December 2017 vs. $19,490 in November 2020. Technically, this is a Double-Top setup.
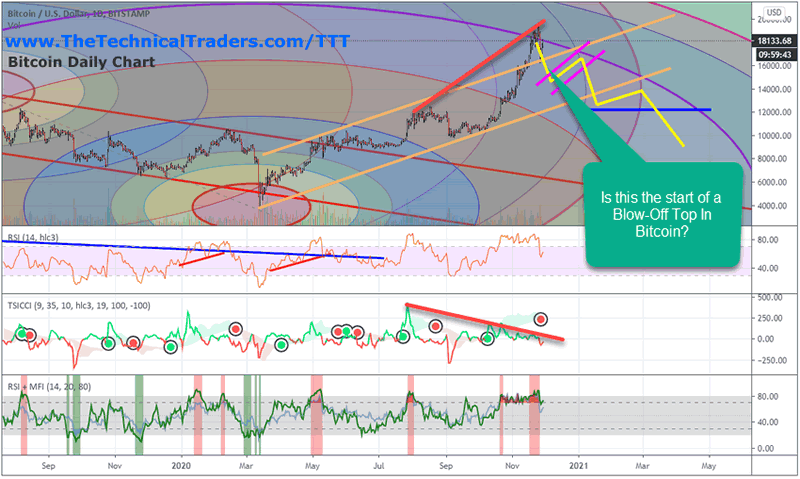
DAILY BITCOIN ANALYSIS
If our five phases of a Blow-Off Top starts to set up and execute in Bitcoin, the next phase will be an immediate downside price correction that sets up the sideways “FLAG” formation in the pattern. This is the initial attempt to support the current rally mode in the markets after reaching a price peak. Usually, the FLAG formation fails with a breakdown in price that sets up the “FINAL SUPPORT DEFENSE LEVEL”. We also see a clear Divergence between price highs and technical indicators recently. This is a moderately clear indicator that price levels have reached over-extended levels recently. We’ve drawn what we believe may happen on this Daily Bitcoin chart (below).
Our Advanced Fibonacci Price Amplitude Arcs from the March 2020 lows shows a very clear DARK PURPLE (3.618) Fibonacci Price Amplitude Arc that has arced across the recent peak in prices. It is our believe that this level will continue to act as major resistance going forward. The way we interpret these Fibonacci Price Amplitude Arcs is to see how price reacts in the current and past related to these price energy fields. If price prompts a major change in trend near these levels, then they may have greater relevance/importance in how price trend resolves near these levels.
BITCOIN WEEKLY ANALYSIS
The following Weekly Bitcoin chart highlights the same Blow-Off top setup on a longer-term scale. The divergence between the June 2019 peak and the current peak in price is very clear. Any further downside price rotation following our drawn YELLOW line on this chart would likely setup the sideways FLAG price setup – indicating phases I and II have setup near this potential Blow-Off Top formation. This suggests that phases III through V are pending.
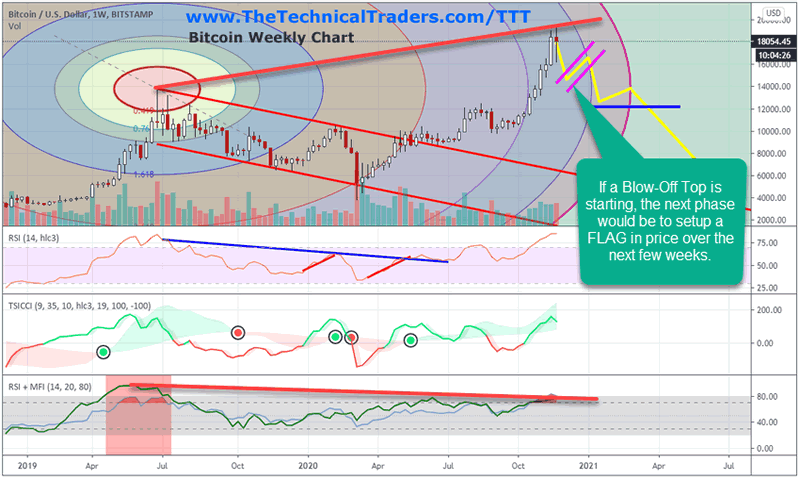
Follow the YELLOW lines on this chart to see what we believe may be a future Blow-Off peak price trend in the future. Remember, this is all contingent on the pattern continuing to play out as we believe will happen in the future. If this pattern breaks down and fails, then we’ll begin to look at other technical setups that may form for Bitcoin.
Currently, a massive RISK ON phase has taken place in the global markets. Prior to the November US elections, many traders/investors were sitting on their capital waiting for clarity regarding the outcome. Just before the election, you can see that Bitcoin began to rally from near $10,000 to above $13,000. Then, as the RISK ON trades piled into the trend, it rallied even further to levels above $19,000 – just like what happened back in 2017.
Be sure to sign up for our free market trend analysis and signals now so you don’t miss our next special report!
In fact, the rally in Bitcoin started in October 2017 and really broke out in November 2017. Once Bitcoin started rallying $4k to $5k per week back in 2017, this represented an “exhaustion rally phase” that ended quite quickly. Currently, Bitcoin is rallying $2,500 to $3,500 per week and we believe it is very close to completing the start of a Blow-Off Top setup for a dramatic drop.
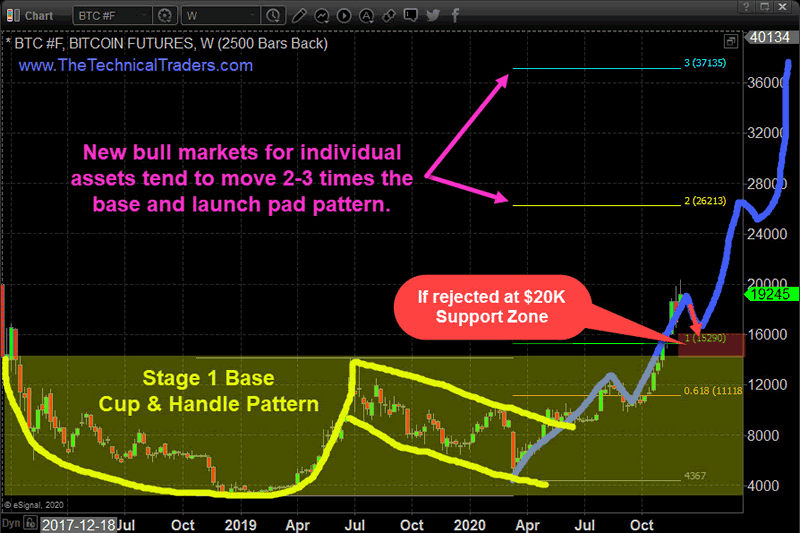
But as always, we will let the charts tell us which way it goes from here. This $20,000 level were price is chopping around could be a launch pad for much another huge rally. The multi year basing pattern that has been formed from late 2018 is pointing to a next upside target of $26,200, then $37,200. Either way, its going to be a WILD ride!
If you want to catch the next big Bitcoin trend then sign up for the Technical Trader newsletter service today at www.TheTechnicalTraders.com. I can help you find and identify great trading opportunities with my daily pre-market video reports that walk you through the charts of all the major asset classes, identifying support and resistance levels as well as technical setups.
Chris Vermeulen
www.TheTechnicalTraders.com
Chris Vermeulen has been involved in the markets since 1997 and is the founder of Technical Traders Ltd. He is an internationally recognized technical analyst, trader, and is the author of the book: 7 Steps to Win With Logic
Through years of research, trading and helping individual traders around the world. He learned that many traders have great trading ideas, but they lack one thing, they struggle to execute trades in a systematic way for consistent results. Chris helps educate traders with a three-hour video course that can change your trading results for the better.
His mission is to help his clients boost their trading performance while reducing market exposure and portfolio volatility.
He is a regular speaker on HoweStreet.com, and the FinancialSurvivorNetwork radio shows. Chris was also featured on the cover of AmalgaTrader Magazine, and contributes articles to several leading financial hubs like MarketOracle.co.uk
Disclaimer: Nothing in this report should be construed as a solicitation to buy or sell any securities mentioned. Technical Traders Ltd., its owners and the author of this report are not registered broker-dealers or financial advisors. Before investing in any securities, you should consult with your financial advisor and a registered broker-dealer. Never make an investment based solely on what you read in an online or printed report, including this report, especially if the investment involves a small, thinly-traded company that isn’t well known. Technical Traders Ltd. and the author of this report has been paid by Cardiff Energy Corp. In addition, the author owns shares of Cardiff Energy Corp. and would also benefit from volume and price appreciation of its stock. The information provided here within should not be construed as a financial analysis but rather as an advertisement. The author’s views and opinions regarding the companies featured in reports are his own views and are based on information that he has researched independently and has received, which the author assumes to be reliable. Technical Traders Ltd. and the author of this report do not guarantee the accuracy, completeness, or usefulness of any content of this report, nor its fitness for any particular purpose. Lastly, the author does not guarantee that any of the companies mentioned in the reports will perform as expected, and any comparisons made to other companies may not be valid or come into effect.
Chris Vermeulen Archive |
© 2005-2022 http://www.MarketOracle.co.uk - The Market Oracle is a FREE Daily Financial Markets Analysis & Forecasting online publication.